. 2014 Oct;94(1):21-40.
doi: 10.1111/mmi.12745. Epub 2014 Aug 21.

Pbp2x localizes separately from Pbp2b and other peptidoglycan synthesis proteins during later stages of cell division of Streptococcus pneumoniae D39

Affiliations

Pbp2x localizes separately from Pbp2b and other peptidoglycan synthesis proteins during later stages of cell division of Streptococcus pneumoniae D39

Ho-Ching T Tsui et al. Mol Microbiol. 2014 Oct.

Abstract

The relative localization patterns of class B penicillin-binding proteins Pbp2x and Pbp2b were used as positional indicators of septal and peripheral (side-wall-like) peptidoglycan (PG) synthesis, respectively, in the mid-cell regions of Streptococcus pneumoniae cells at different stages of division. We confirm that Pbp2x and Pbp2b are essential in the strain D39 genetic background, which differs from that of laboratory strains. We show that Pbp2b, like Pbp2x and class A Pbp1a, follows a different localization pattern than FtsZ and remains at division septa after FtsZ reappears at the equators of daughter cells. Pulse-experiments with fluorescent D-amino acids (FDAAs) were performed in wild-type cells and in cells in which Pbp2x activity was preferentially inhibited by methicillin or Pbp2x amount was depleted. These experiments show that Pbp2x activity separates from that of other PBPs to the centres of constricting septa in mid-to-late divisional cells resolved by high-resolution 3D-SIM microscopy. Dual-protein and protein-fluorescent vancomycin 2D and 3D-SIM immunofluorescence microscopy (IFM) of cells at different division stages corroborate that Pbp2x separates to the centres of septa surrounded by an adjacent constricting ring containing Pbp2b, Pbp1a and regulators, StkP and MreC. The separate localization of Pbp2x suggests distinctive roles in completing septal PG synthesis and remodelling.


Figures

Fig. 1
Fig. 1
Introductory model of PG biosynthesis in ovococcus bacteria, such as S. pneumoniae, and summary of phenotypes caused by disruption of septal and peripheral PG synthesis. A. Top. Ovococci divide perpendicularly to their long axis (Zapun et al., 2008b). Unencapsulated derivatives of wild-type S. pneumoniae form mostly diplococci and chains of two cells, whereas capsulated strains form short chains of 8-10 cells (Barendt et al., 2009). Bottom. Formation of prolate-ellipsoid-shaped bacteria requires two modes of PG synthesis, peripheral (side-wall-like) and septal PG synthesis, that occur in the midcell regions of dividing S. pneumoniae cells (Massidda et al., 2013, Pinho et al., 2013, Sham et al., 2012, Zapun et al., 2008b). At the start of a division cycle, components of both peripheral PG synthesis complexes (orange ovals) and septal synthesis complexes (green rectangles) locate to the equators of cells (bottom). Peripheral PG synthesis (light blue; top) occurs between the future equator and septum of dividing cells and may commence before septal synthesis (Massidda et al., 2013, Wheeler et al., 2011, Zapun et al., 2008b). At some point, septal PG synthesis (medium blue) commences to divide the cell in two. Data presented in this paper show that the complexes that carry out peripheral and septal PG synthesis locate to a large constricting ring throughout the division cycle, with the exception of Pbp2x, which moves to the centers of septa in mid-to-late divisional cells. The grey Pac-Man corresponds to PG hydrolases that remodel the PG and allow septal separation. B. Comparison of morphological changes of cells of an unencapsulated derivative of S. pneumoniae D39 when septal (top) or peripheral PG synthesis (bottom) is blocked. Septal PG synthesis and ring closure is blocked by selective inhibition of Pbp2x by methicillin (Land et al., 2013), depletion of Pbp2x (Results) (Berg et al., 2013, Peters et al., 2014), or GpsB depletion (Land et al., 2013), causing cell elongation. Peripheral PG synthesis is blocked by depletion of Pbp2b (Results) (Berg et al., 2013), or MreC (Land & Winkler, 2011), causing formation of similar-looking chains of nearly spherical cells. See text for additional details. All micrographs are at the same magnification, with scale bar = 1 μm.
Fig. 2
Fig. 2
Different localization patterns of Pbp2b and FtsZ during later stages of pneumococcal cell division. A. Averaged images and fluorescence intensity traces of strain IU7217 (FtsZ-Myc Pbp2b-HA) grown to mid-exponential phase in BHI broth and processed for dual-protein 2D IFM and DAPI labeling (see Experimental procedures). Cells were binned into division stages 1-4, and images from the indicated number of cells (n) from two independent biological replicates were averaged using the IMA-GUI program described in Experimental procedures. Row 1, cell shapes from phase-contrast images; row 2, nucleoid locations from DAPI labeling; row 3, Pbp2b locations from IFM; row 4, FtsZ locations from IFM; row 5, normalized mean fluorescence intensity distributions along the horizontal cell axis for each channel (black, phase image; blue, DNA; green, Pbp2b; red, FtsZ). B. Scatter plot of the paired widths from the same cells of FtsZ and Pbp2b fluorescent immunolabeled regions at the midcell equators or septa of strain IU7217 at division stages 1-3. Width measurements and plotting were done using the IMA-GUI program (see Experimental procedures). The dotted reference line intercepts the origin with slope = 1. Differences between the paired widths were calculated for each cell in each divisional stage, and the null hypothesis that the mean difference was 0 was tested by a 1-sample Student t test, where **, p<0.01; ***, p<0.001. Septal widths of stage 4 cells were not analyzed, because FtsZ had re-located from septa to equators of daughter cells. Similar results for FtsZ and Pbp2b localization were obtained for strain IU7944 (FtsZ-Myc Pbp2b-HA4) (data not shown). C. Representative 3D-SIM IFM and DAPI images of strain IU7944 (FtsZ-Myc Pbp2b-HA4) at different division stages. DNA (DAPI stained image) is false-colored white or blue in columns 1 or 5, respectively. FtsZ and Pbp2b are pseudo-colored as green and red respectively, and overlapping signal is colored yellow. The first row of each panel represents images captured in the XY plane, while second row images were obtained by rotating a section of the mid-cell region around the X or Y axis. In stage 3 cells, FtsZ has begun to re-locate to equators, while Pbp2b remains largely at the septum (arrows). Images are representative of >20 examined cells in different division stages from one experiment. Similar 3D-SIM results were obtained for strain IU7217 (FtsZ-Myc Pbp2b-HA). (data not shown). Scale bar = 1 μm.
Fig. 3
Fig. 3
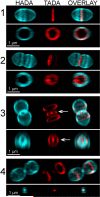
Pulse labeling with FDAAs reveals separate locations of PBP transpeptidase activity in mid-to-late divisional pneumococcal cells. Strain IU1945 (D39 Δcps) growing exponentially in BHI broth at 37°C was pre-labeled with FDAA HADA (pseudo-colored blue), washed, and pulsed for 5 min with FDAA TADA (pseudo-colored red) as described in Experimental procedures. Cells were visualized by 3D-SIM. The first row of each panel represents images captured in the XY plane, while second row images were obtained by rotating a section of the midcell region around the X or Y axis. Numbers indicate stages of cell division. In stage 3 mid-to-late divisional cells, FDAA labeling occurs at two distinct regions of the septum (arrows). Images are representative of >100 3D-reconstructed cells in different division stages from >3 experiments. Scale bar = 1 μm.
Fig 4
Fig 4
Lack of central septal FDAA labeling in cells treated with a concentration of methicillin that preferentially inhibits the transpeptidase activity of pneumococcal Pbp2x. Cultures of exponentially growing wild-type strain IU1945 (D39 Δcps) were split, duplicate cultures were treated with methicillin (0.1 μg mL−1) for 40 min, and treated and untreated cultures were pulse labeled for 5 min with FDAA TADA (pseudo-colored red) (see Experimental procedures). Two views of 3D-SIM images of untreated (left) and methicillin-treated (right) cells are shown. The first column of each condition is in the XY plane, and the second column is a rotation of the entire cell around X or Y axis as indicated by the line inside the circular arrows. Methicillin-treated cells are elongated and rings lack the central septal disks of FDAA labeling seen in untreated cells (arrows). Images are representative of >60 3D-reconstructed stage-3 cells for each condition from two biological replicates. Scale bar = 1 μm.
Fig 5
Fig 5
Lack of central septal FDAA labeling in pneumococcal cells depleted of Pbp2x, but not cells depleted of Pbp2b. A. Wild-type strain IU1945 and pbp2x merodiploid strain IU7506 (Δpbp2x//CEP::PfcsK-pbp2x+) were grown exponentially, and IU7506 was depleted of Pbp2x by shifting to BHI broth lacking fucose as described in Experimental procedures. Pre-labeling with FDAA HADA (pseudo-colored blue), pulse-labeling with FDAA TADA (pseudo-colored red) for 5 min, fixation, and 3D-SIM were performed as described in Experimental procedures. Each panel shows four views of the same dividing cell at division stage 3, with the top two images in the XY plane and the bottom two images rotated as indicated. Wild-type and merodiploid cells expressing Pbp2x have central septal disks of FDAA labeling (long arrows), whereas cells depleted of Pbp2x lack central FDAA labeling in septa (short arrows). Pbp2x was overexpressed ≈2X in strain IU7506 + fucose, accounting for the slightly smaller cells and contiguous disks of FDAA labeling (see text). B. pbp2b merodiploid strain IU7397 (Δpbp2b//ΔbgaA::PfcsK-pbp2b+) was grown, depleted for Pbp2b, and labeled with FDAAs as described above for A and in Experimental procedures. Rings and central FDAA labeling of septa of division stage 3 cells were observed in all cells (long arrows). In about 30% of the spherical Pbp2b-depleted cells, the division plane was unhinged (large arrow; see text). For A or B, images are representative of 27 3D-reconstructed stage 3 cells for each condition from two biological replicates.
Fig. 6
Fig. 6
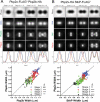
2D-IFM analysis showing separate positioning of (A) Pbp2b and Pbp2x and (B) StkP and Pbp2x in septa of mid-to-late divisional pneumococcal cells. Top panels are averaged images and normalized mean fluorescence intensity traces, and bottom graphs are scatter plots of labeled widths obtained from (A) strain IU7145 (Pbp2x-FLAG3 Pbp2b-HA) and (B) strain IU7510 (StkP-FLAG2 Pbp2x-HA). Dual-protein 2D IFM and DAPI labeling were performed as described in Experimental procedures. Image averaging and generation of scatter plots of paired labeled widths at midcell equators and septa were done as described for Fig. 2 and in Experimental procedures and (Land et al., 2013). NS, not significant (i.e. difference of means of paired widths = 0); **, p<0.01; and ***, p<0.001. The data shown were obtained from two independent biological replicate experiments.
Fig. 7
Fig. 7
Representative 3D-SIM IFM images confirming separate positioning of (A) Pbp2b and Pbp2x and (B) StkP and Pbp2x in septa of mid-to-late divisional pneumococcal cells. Representative 3D-SIM IFM images of strain IU7145 (Pbp2x-FLAG3 Pbp2b-HA) and IU7510 (Pbp2x-HA StkP-FLAG2) at different division stages were obtained as described in Experimental procedures. Arrangement of panels and pseudo-coloring is similar to Fig. 2, except red and green correspond to Pbp2x and Pbp2b in (A), and Pbp2x and StkP in (B), respectively. The first row of each panel represents images captured in the XY plane, while second row images were obtained by rotating a section of the midcell region around the X or Y axis. In stage 1 cells, Pbp2x colocalizes with Pbp2b and StkP; however by stages 2 and 3, Pbp2x separates from Pbp2b and StkP and eventually forms a disk in the septum surrounded by rings of Pbp2b and StkP (arrows). Between stage 3 and 4, Pbp2x appears as one layer between two layers of Pbp2b on the sides of the new daughter cells (also see Fig. 9B) (arrows). Images are representative of >30 examined cells in different division stages from two biological replicates. Scale bar = 1 μm.
Fig. 8
Fig. 8
2D-IFM analysis showing that Pbp2b, Pbp1a, MreC, and StkP colocalize in midcell rings of similar diameters at all stages of pneumococcal cell division. Top panels are averaged images and normalized mean fluorescence intensity traces, and bottom graphs are scatter plots of labeled widths obtained from (A) IU7363 (Pbp2b-HA Pbp1a-L-FLAG3), (B) IU7752 (Pbp2b-HA4 MreC-L-FLAG3), and (C) IU7512 (StkP-FLAG2 Pbp2b-HA). Dual-protein 2D IFM and DAPI labeling were performed as described in Experimental procedures. Image averaging and generation of scatter plots of paired labeled widths at midcell equators and septa were done as described for Figure 2 and in Experimental procedures and (Land et al., 2013). NS, not significant (i.e. difference of means of paired widths = 0); **, p<0.01; and ***, p<0.001. Data shown were obtained from two independent biological replicates.
Fig. 9
Fig. 9
Representative 3D-SIM images confirming that Pbp2b, Pbp1a, MreC, and StkP colocalize in a constricting midcell ring during pneumococcal cell division. Representative 3D-SIM IFM images were obtained from (A) IU7363 (Pbp1a-L-FLAG3 Pbp2b-HA), (B) IU7752 (Pbp2b-HA4 MreC-L-FLAG3), and (C) IU7512 (Pbp2b-HA StkP-FLAG2) at different division stages. Arrangements of panels are similar to Fig. 2C and 7. Images shown are representative of >30 examined cells in different division stages from two biological replicates. Scale bar = 1 μm.
Fig. 10
Fig. 10
2D-IFM analysis showing smaller septal width of Pbp2x, but larger septal widths of other PG synthesis proteins compared to FL-V staining at different stages of pneumococcal cell division. Dual FL-V staining and protein IFM was performed as described in Experimental procedures. Top panels are averaged images and normalized mean fluorescence intensity traces, and bottom graphs are scatter plots of labeled widths for FL-V staining and immunolabeled proteins for (A) IU6929 (Pbp2x-HA), (B) IU7426 (Pbp2b-HA4), and (C) IU5544 (Pbp1a-L-FLAG3). Image averaging and generation of scatter plots of paired labeled widths at midcell equators and septa were done as described for Fig. 2 and in Experimental procedures and (Land et al., 2013). NS, not significant (i.e. difference of means of paired widths = 0); **, p<0.01; and ***, p<0.001. Data shown were obtained from two independent biological replicates.
Fig. 11
Fig. 11
Representative 3D-SIM images showing different distributions of the PBPs with respect to FL-V staining of (A) IU6929 (Pbp2x-HA), (B) IU7426 (Pbp2b-HA4), and (C) IU5544 (Pbp1a-L-FLAG3). Dual FL-V staining and protein IFM was performed as described in Experimental procedures. FL-V stain is pseudo-colored green, and Pbp2x (A), Pbp2b (B) and Pbp1a (C) are pseudo-colored as red, and overlapping FL-V and PBP signal is represented by yellow. Numbers to the left of each panel indicate division stages. The first row of each panel shows images captured in the XY plane, while second row images were obtained by rotating a section of the mid-cell region around the X or Y axis. In mid-to-late stage 3 divisional cells, FL-V staining is splitting between the daughter cells, Pbp2x (A) is present in septal centers, and Pbp2b (B) and Pbp1a (C) are present in the outer rims of FL-V labeling (arrows). Images shown are representatives of >20 examined cells in different division stages from two biological replicates. Scale bar = 1 μm.
Fig. 12
Fig. 12
Summary of localization patterns of S. pneumoniae PBPs, PG synthesis regulators StkP and MreC, and regions of fluorescent-vancomycin (FL-V) staining at different stages of cell division. Sections of midcells looking down the long axes of cells are illustrated. In pre-divisional cells, all proteins and FtsZ are located in an equatorial ring that will become the septum. The FtsZ and PG synthesis protein rings likely coincide, although FtsZ rings appear to be smaller than PG synthesis protein rings, because the FtsZ epitope tag is cytoplasmic, whereas the epitope tags on PG synthesis proteins are extracellular (see text). In mid-divisional cells, Pbp2x has started to form a ring inside of the constricting septal ring that contains the other proteins and surrounds regions of FL-V staining; FtsZ has started to disappear from the septum and reorganize at the equators of daughter cells. In mid-to-late division, FtsZ has left septa and is assembling into new equatorial rings, Pbp2x has moved to septal centers overlapping regions of FL-V staining, while the other proteins remain in a constricting septal ring surrounding regions of FL-V staining. In the last stages of division, cells have or are about to fully separate and the remaining proteins and FL-V staining condense into a polar dot; most of these proteins have started to reassemble at the equatorial rings or daughter cells. See text for additional details.

Comment in

References

    1. Barendt SM, Land AD, Sham LT, Ng WL, Tsui HC, Arnold RJ, Winkler ME. Influences of capsule on cell shape and chain formation of wild-type and pcsB mutants of serotype 2 Streptococcus pneumoniae. J Bacteriol. 2009;191:3024–3040. - PMC - PubMed
    1. Barendt SM, Sham LT, Winkler ME. Characterization of mutants deficient in the L,D-carboxypeptidase (DacB) and WalRK (VicRK) regulon, involved in peptidoglycan maturation of Streptococcus pneumoniae serotype 2 strain D39. J Bacteriol. 2011;193:2290–2300. - PMC - PubMed
    1. Bartual SG, Straume D, Stamsas GA, Munoz IG, Alfonso C, Martinez-Ripoll M, Havarstein LS, Hermoso JA. Structural basis of PcsB-mediated cell separation in Streptococcus pneumoniae. Nature commun. 2014;5:3842. - PubMed
    1. Beilharz K, Novakova L, Fadda D, Branny P, Massidda O, Veening JW. Control of cell division in Streptococcus pneumoniae by the conserved Ser/Thr protein kinase StkP. Proc Nat Acad Sci U.S.A. 2012;109:E905–913. - PMC - PubMed
    1. Berg KH, Stamsas GA, Straume D, Havarstein LS. Effects of low PBP2b levels on cell morphology and peptidoglycan composition in Streptococcus pneumoniae R6. J Bacteriol. 2013;195:4342–4354. - PMC - PubMed

Publication types

MeSH terms

Substances