Review
. 2014 Nov 7;43(21):7267-78.
doi: 10.1039/c4cs00128a. Epub 2014 Aug 7.

Nanoparticle counting: towards accurate determination of the molar concentration

Affiliations
Review

Nanoparticle counting: towards accurate determination of the molar concentration

Jing Shang et al. Chem Soc Rev. .

Abstract

Innovations in nanotechnology have brought tremendous opportunities for the advancement of many research frontiers, ranging from electronics, photonics, energy, to medicine. To maximize the benefits of nano-scaled materials in different devices and systems, precise control of their concentration is a prerequisite. While concentrations of nanoparticles have been provided in other forms (e.g., mass), accurate determination of molar concentration, arguably the most useful one for chemical reactions and applications, has been a major challenge (especially for nanoparticles smaller than 30 nm). Towards this significant yet chronic problem, a variety of strategies are currently under development. Most of these strategies are applicable to a specialized group of nanoparticles due to their restrictions on the composition and size range of nanoparticles. As research and uses of nanomaterials are being explored in an unprecedented speed, it is necessary to develop universal strategies that are easy to use and are compatible with nanoparticles of different sizes, compositions, and shapes. This review outlines the theories and applications of current strategies to measure nanoparticle molar concentration, discusses the advantages and limitations of these methods, and provides insights into future directions.


Figures

Figure 1
Figure 1
Schematic summary of methods to measure nanoparticle molar concentration.
Figure 2
Figure 2
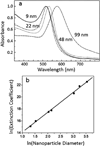
Relationship of UV-Vis extinction and size of gold nanoparticles. (a) UV-Vis spectra of gold nanoparticles with different diameters. The wavelength of maximum extinction depends on the size of gold nanoparticles. Reprinted with permission from ref. . Copyright (1999) American Chemical Society. (b) Linear relationship of the natural logarithm of extinction coefficients (L mole−1 cm−1) vs. logarithm of average gold nanoparticle core diameters (nm). Reprinted from ref. , with permission from Elsevier.
Figure 3
Figure 3
Illustration of the laser-induced breakdown detection method (LIBD) for nanoparticle quantification. (a) Scheme of laser-induced breakdown mechanism, adapted from ref. , with permission from John Wiley and Sons. (b) The linear relationship between breakdown probabilities of LIBD and polystyrene particle concentrations, reprinted from ref. , with permission from Elsevier.
Figure 4
Figure 4
Mechanism of resistive-pulse sensors for nanoparticle counting. (a) Schematic setup of one type of resistive-pulse sensors; charged particles migrate through the channel by electric force, adapted from Ref. , with permission from The Royal Society of Chemistry. (b) Typical current-time recordings when nanoparticles pass through the channel, adapted with permission from ref. . Copyright (2001) American Chemical Society.
Figure 5
Figure 5
Diagram of single particle Inductively Coupled Plasma Mass Spectrometry (spICPMS) principle, adapted from ref. , with permission from John Wiley and Sons. (a) Dissolved metal ions are homogeneously distributed in a sample and the intensity of ion peaks keeps relatively constant during the analysis interval. (b) Metal nanoparticles form ion clusters after plasma treatment and produce an instantaneous increase of ion intensity.
Figure 6
Figure 6
Illustration of the nanoparticle tracking analysis (NTA) system, adapted from ref. , with permission from Nanosight Ltd. (a) Scheme of Nanosight configuration. (b) One frame from a video captured by Nanosight; each bright spot represents one nanoparticle in liquid. (c) Typical moving motion of one nanoparticle tracked by NTA software.
Figure 7
Figure 7
Counting nanoparticles using nanopipet and TEM. (a) Scheme of the TEM microchip nanopipet. (b) Illustration of nanopipet preventing larger substances in the blood entering the chamber. (c) Comparison of nanoparticle TEM images generated by normal drying process (gradual evaporation of solvent on copper grids) and vacuum drying process in a nanopipet. Normal drying leads to aggregation of nanoparticles on copper grids coated with either hydrophobic carbon or hydrophilic SiOx film; vacuum drying in the nanopipet results in homogeneous distribution of nanoparticles on a hydrophilic SixNy film. Adapted with permission from ref. . Copyright (2012) American Chemical Society.

References

    1. Daniel MC, Astruc D. Chem. Rev. 2004;104:293–346. - PubMed
    1. Scholl JA, Koh AL, Dionne JA. Nature. 2012;483:421–427. - PubMed
    1. Liu X, Atwater M, Wang J, Huo Q. Colloids Surf., B. 2007;58:3–7. - PubMed
    1. Moreels I, Lambert K, De Muynck D, Vanhaecke F, Poelman D, Martins JC, Allan G, Hens Z. Chem. Mater. 2007;19:6101–6106.
    1. Cheng F-Y, Su C-H, Yang Y-S, Yeh C-S, Tsai C-Y, Wu C-L, Wu M-T, Shieh D-B. Biomaterials. 2005;26:729–738. - PubMed

Publication types

MeSH terms