

The global pattern of urbanization and economic growth: evidence from the last three decades
- PMID: 25099392
- PMCID: PMC4123908
- DOI: 10.1371/journal.pone.0103799
The global pattern of urbanization and economic growth: evidence from the last three decades
Abstract
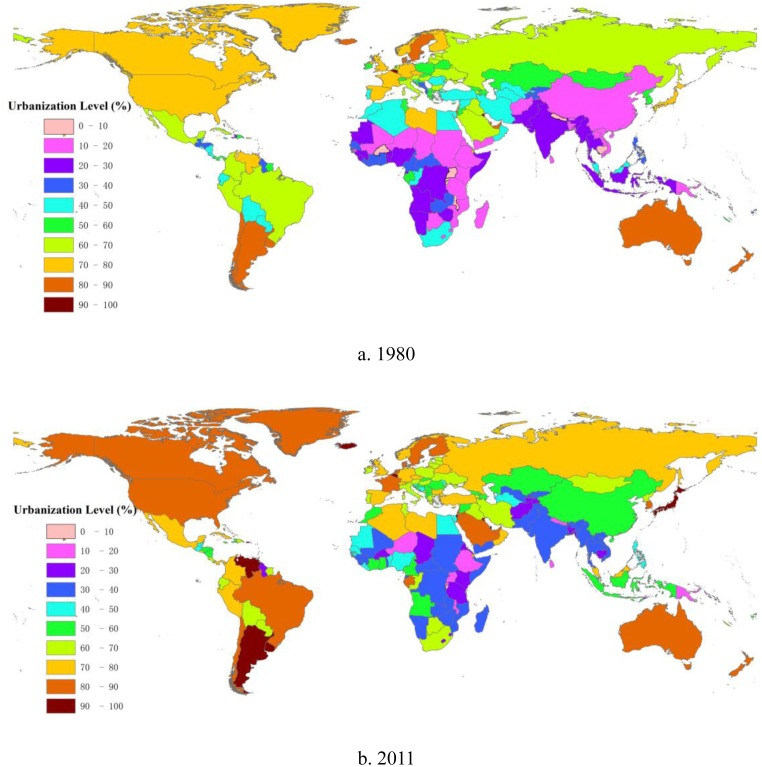
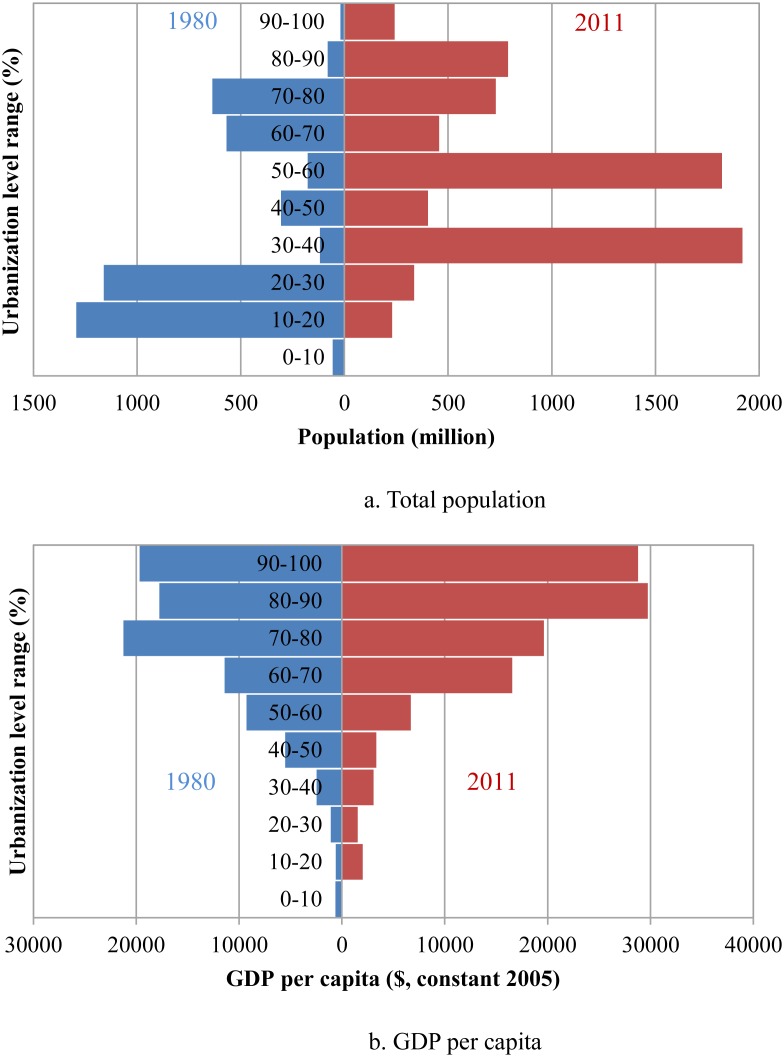
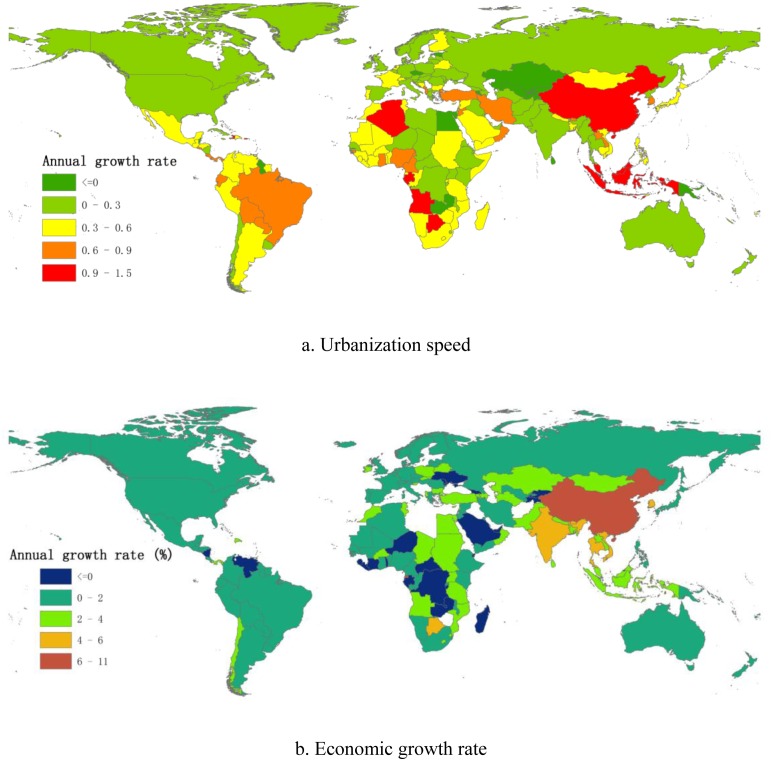
The relationship between urbanization and economic growth has been perplexing. In this paper, we identify the pattern of global change and the correlation of urbanization and economic growth, using cross-sectional, panel estimation and geographic information systems (GIS) methods. The analysis has been carried out on a global geographical scale, while the timescale of the study spans the last 30 years. The data shows that urbanization levels have changed substantially during these three decades. Empirical findings from cross-sectional data and panel data support the general notion of close links between urbanization levels and GDP per capita. However, we also present significant evidence that there is no correlation between urbanization speed and economic growth rate at the global level. Hence, we conclude that a given country cannot obtain the expected economic benefits from accelerated urbanization, especially if it takes the form of government-led urbanization. In addition, only when all facets are taken into consideration can we fully assess the urbanization process.
Conflict of interest statement
Figures
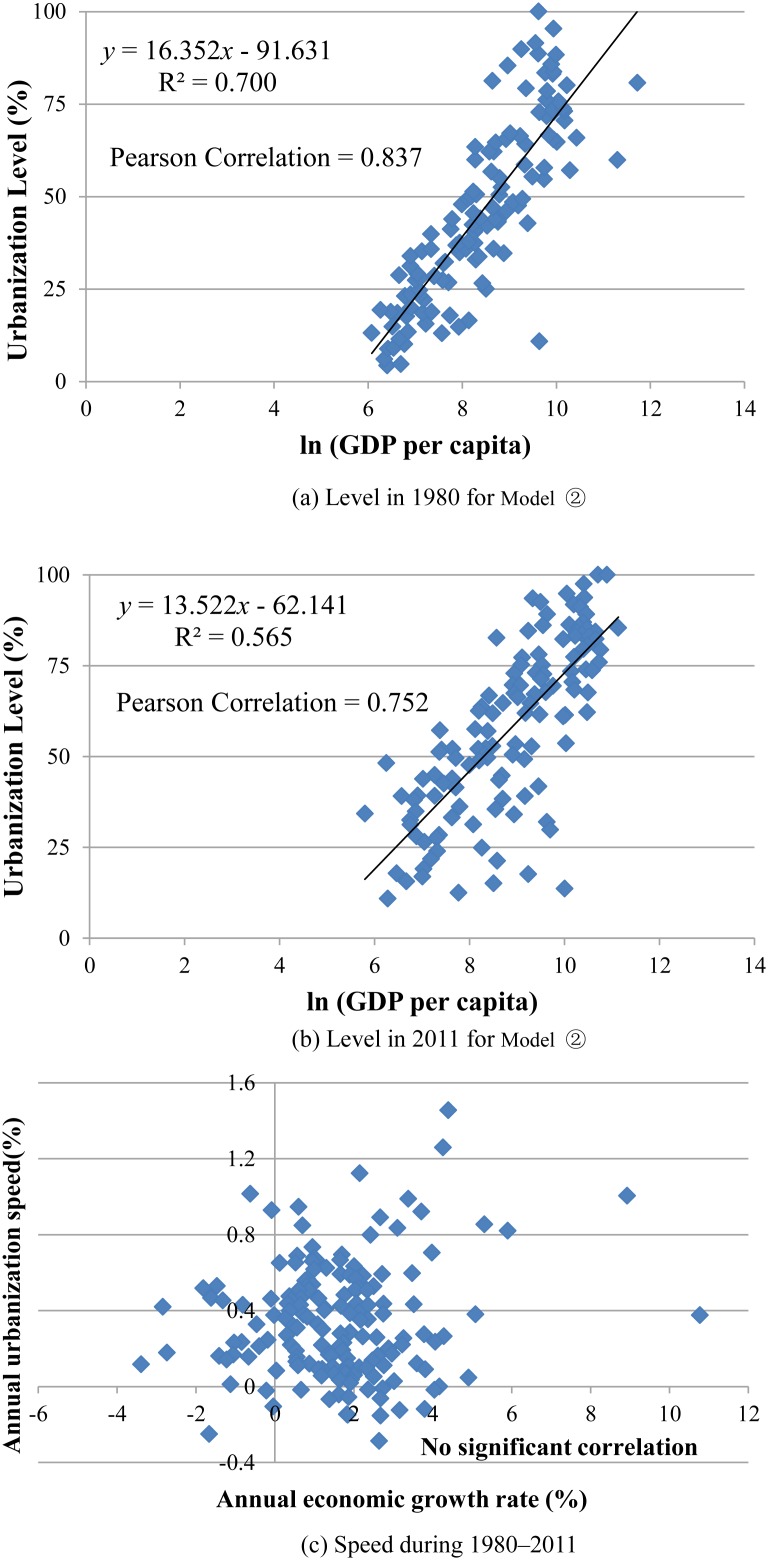
 , for level in 1980 and 2011, and for speed during 1980–2011. (a) and (b) show the correlation between urbanization level and GDP per capita in 1980 and 2011, respectively. (c) shows the correlation between speed of urbanization and economic growth rate during 1980–2011. Please note the marked correlation difference between level and speed of urbanization and economic growth in the world.
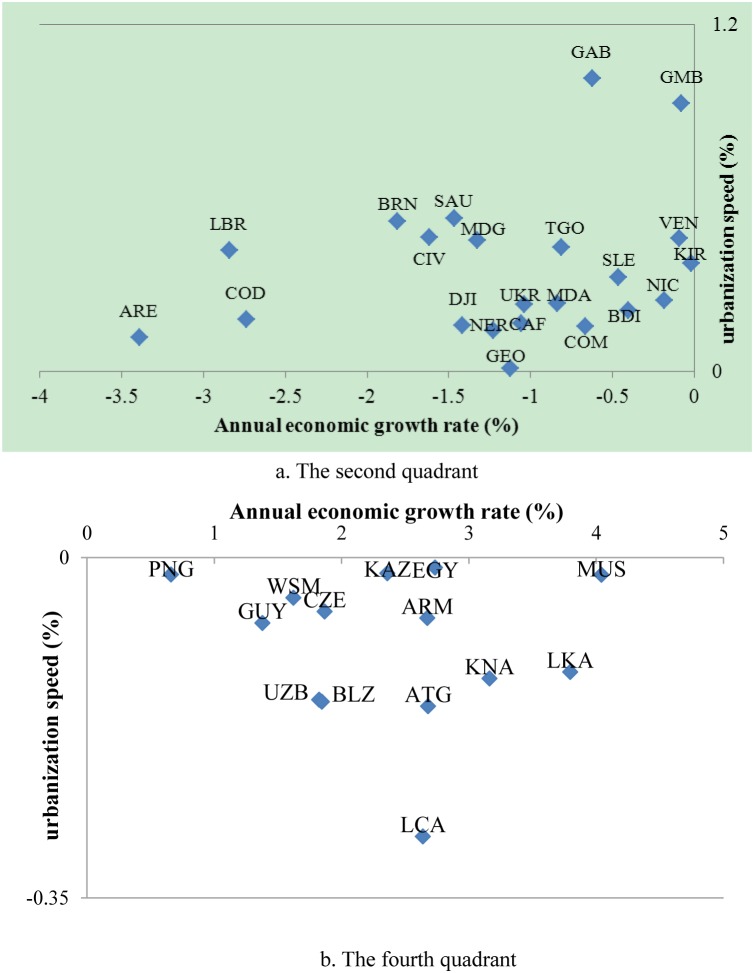
References
-
- Chenery HB, Taylor L (1968) Development patterns: among countries and over time. The Review of Economics and Statistics 50: 391–416.
-
- Henderson V (2003) The urbanization process and economic growth: The so-what question. Journal of Economic Growth 8: 47–71.
-
- Pugh C (1995) Urbanization in developing countries: an overview of the economic and policy issues in the 1990s. Cities 12: 381–398. - PubMed
-
- Friedmann J (2006) Four theses in the study of China’s urbanization. International journal of urban and regional research 30: 440–451.
-
- Hope KR (1998) Urbanization and urban growth in Africa. Journal of Asian and African Studies 33: 345–358.
Publication types
MeSH terms
LinkOut - more resources
Full Text Sources
Other Literature Sources
