

Photon hunting in the twilight zone: visual features of mesopelagic bioluminescent sharks
- PMID: 25099504
- PMCID: PMC4123902
- DOI: 10.1371/journal.pone.0104213
Photon hunting in the twilight zone: visual features of mesopelagic bioluminescent sharks
Abstract
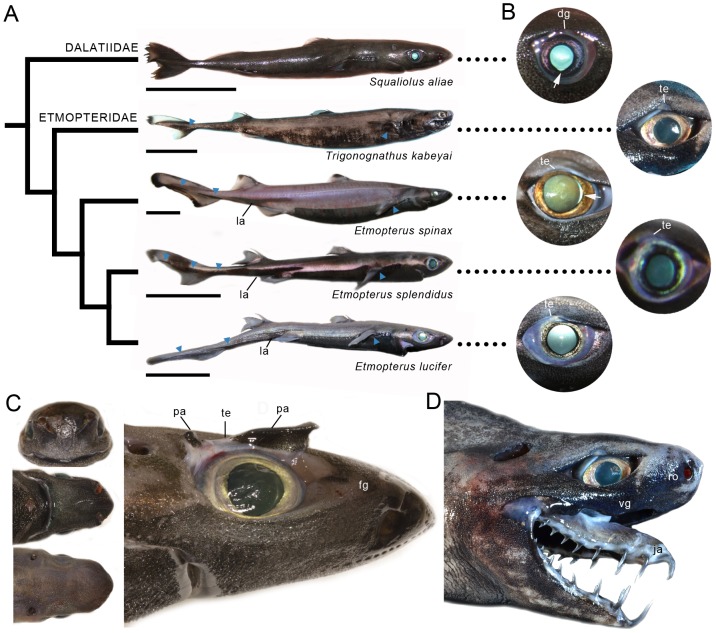
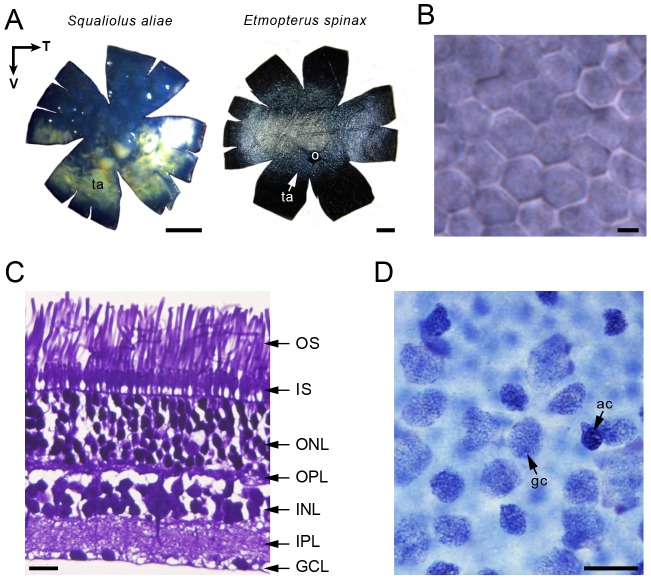
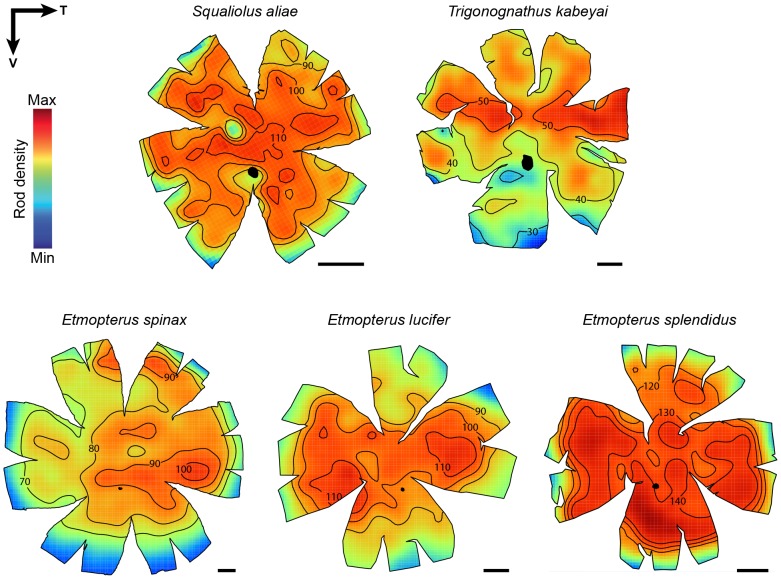
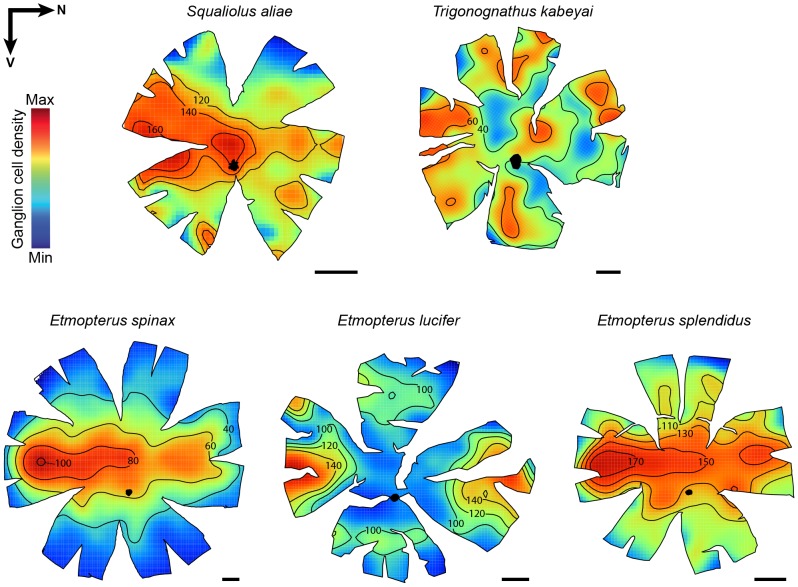
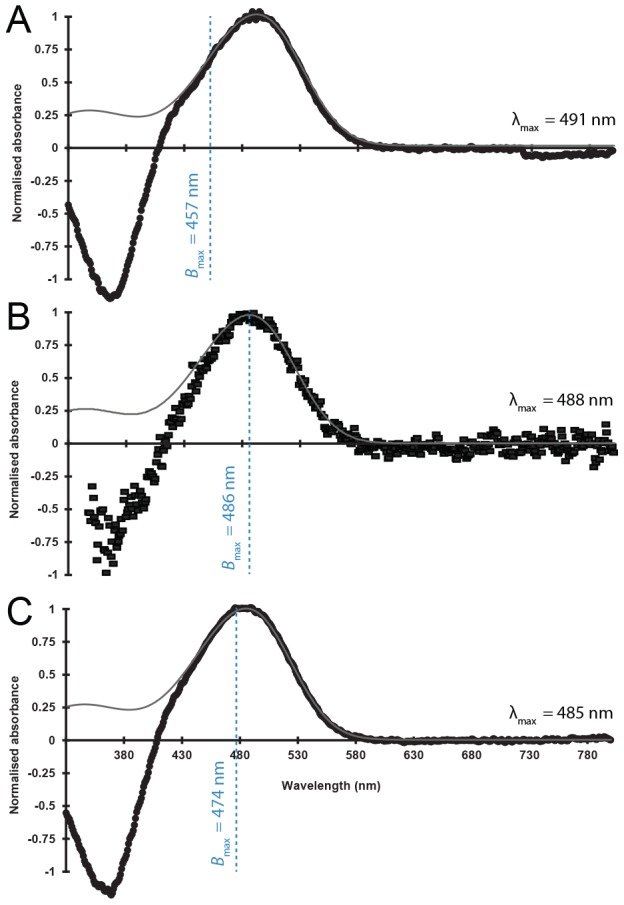
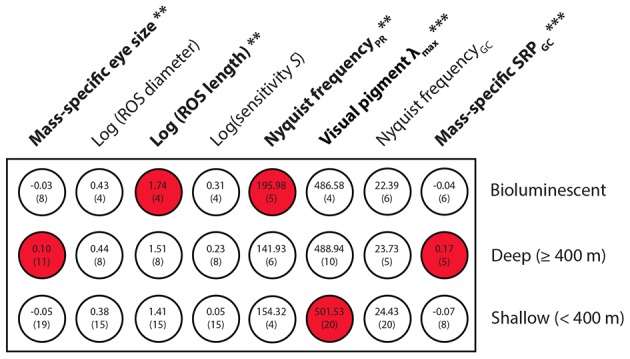
The mesopelagic zone is a visual scene continuum in which organisms have developed various strategies to optimize photon capture. Here, we used light microscopy, stereology-assisted retinal topographic mapping, spectrophotometry and microspectrophotometry to investigate the visual ecology of deep-sea bioluminescent sharks [four etmopterid species (Etmopterus lucifer, E. splendidus, E. spinax and Trigonognathus kabeyai) and one dalatiid species (Squaliolus aliae)]. We highlighted a novel structure, a translucent area present in the upper eye orbit of Etmopteridae, which might be part of a reference system for counterillumination adjustment or acts as a spectral filter for camouflage breaking, as well as several ocular specialisations such as aphakic gaps and semicircular tapeta previously unknown in elasmobranchs. All species showed pure rod hexagonal mosaics with a high topographic diversity. Retinal specialisations, formed by shallow cell density gradients, may aid in prey detection and reflect lifestyle differences; pelagic species display areae centrales while benthopelagic and benthic species display wide and narrow horizontal streaks, respectively. One species (E. lucifer) displays two areae within its horizontal streak that likely allows detection of conspecifics' elongated bioluminescent flank markings. Ganglion cell topography reveals less variation with all species showing a temporal area for acute frontal binocular vision. This area is dorsally extended in T. kabeyai, allowing this species to adjust the strike of its peculiar jaws in the ventro-frontal visual field. Etmopterus lucifer showed an additional nasal area matching a high rod density area. Peak spectral sensitivities of the rod visual pigments (λmax) fall within the range 484-491 nm, allowing these sharks to detect a high proportion of photons present in their habitat. Comparisons with previously published data reveal ocular differences between bioluminescent and non-bioluminescent deep-sea sharks. In particular, bioluminescent sharks possess higher rod densities, which might provide them with improved temporal resolution particularly useful for bioluminescent communication during social interactions.
Conflict of interest statement
Figures
Similar articles
-
Etmopterus spinax, the velvet belly lanternshark, does not use bacterial luminescence.Acta Histochem. 2019 May;121(4):516-521. doi: 10.1016/j.acthis.2019.04.010. Epub 2019 Apr 23. Acta Histochem. 2019. PMID: 31027729
-
Retinal topography and spectral sensitivity of the Port Jackson shark (Heterodontus portusjacksoni).J Comp Neurol. 2020 Dec 1;528(17):2831-2847. doi: 10.1002/cne.24911. Epub 2020 Apr 11. J Comp Neurol. 2020. PMID: 32227480
-
Retinal ganglion cell distribution and spatial resolving power in elasmobranchs.Brain Behav Evol. 2008;72(1):59-77. doi: 10.1159/000146082. Epub 2008 Aug 5. Brain Behav Evol. 2008. PMID: 18679025
-
Vision in the deep sea.Biol Rev Camb Philos Soc. 2004 Aug;79(3):671-712. doi: 10.1017/s1464793103006420. Biol Rev Camb Philos Soc. 2004. PMID: 15366767 Review.
-
Vision in elasmobranchs and their relatives: 21st century advances.J Fish Biol. 2012 Apr;80(5):2024-54. doi: 10.1111/j.1095-8649.2012.03253.x. Epub 2012 Mar 22. J Fish Biol. 2012. PMID: 22497415 Review.
Cited by
-
The presence of lateral photophores correlates with increased speciation in deep-sea bioluminescent sharks.R Soc Open Sci. 2015 Jul 29;2(7):150219. doi: 10.1098/rsos.150219. eCollection 2015 Jul. R Soc Open Sci. 2015. PMID: 26587280 Free PMC article.
-
Head anatomy of a lantern shark wet-collection specimen (Chondrichthyes: Etmopteridae).J Anat. 2023 May;242(5):872-890. doi: 10.1111/joa.13822. Epub 2023 Jan 25. J Anat. 2023. PMID: 36695312 Free PMC article.
-
Evidence that eye-facing photophores serve as a reference for counterillumination in an order of deep-sea fishes.Proc Biol Sci. 2020 Jun 10;287(1928):20192918. doi: 10.1098/rspb.2019.2918. Epub 2020 Jun 10. Proc Biol Sci. 2020. PMID: 32517614 Free PMC article.
-
Widespread and Convergent Evolution of Cone Monochromacy in Galeomorph Sharks.Mol Biol Evol. 2025 Mar 5;42(3):msaf043. doi: 10.1093/molbev/msaf043. Mol Biol Evol. 2025. PMID: 39937658 Free PMC article.
-
Etmopteridae bioluminescence: dorsal pattern specificity and aposematic use.Zoological Lett. 2019 Mar 6;5:9. doi: 10.1186/s40851-019-0126-2. eCollection 2019. Zoological Lett. 2019. PMID: 30873292 Free PMC article.
References
-
- Warrant EJ, Locket NA (2004) Vision in the deep sea. Biological Reviews 79: 671–712. - PubMed
-
- Marshall NB (1954) Aspects of deep-sea biology. London: Hutchinson 380 p.
-
- Munk O (1980) Hvirveldyrøjet: Bygning, funktion og tilpasning. Copenhagen: Berlingske Forlag 169 p.
-
- Warrant EJ, Collin SP, Locket NA (2003) Eye design and vision in deep-sea fishes. In: Collin SP, Marshall, NJ, editors. Sensory processing in aquatic environments. New York: Springer. pp. 303–322.
Publication types
MeSH terms
LinkOut - more resources
Full Text Sources
Other Literature Sources
