. 2014 Aug 5;107(3):682-693.
doi: 10.1016/j.bpj.2014.05.044.

In situ time-resolved FRET reveals effects of sarcomere length on cardiac thin-filament activation

Affiliations

In situ time-resolved FRET reveals effects of sarcomere length on cardiac thin-filament activation

King-Lun Li et al. Biophys J. .

Abstract

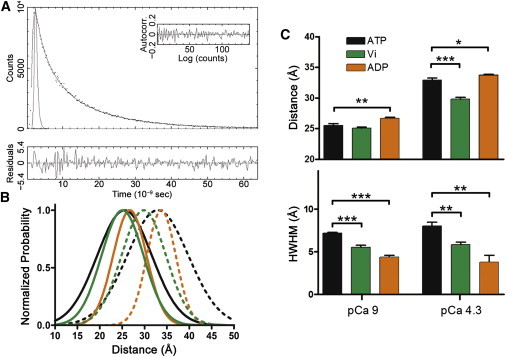
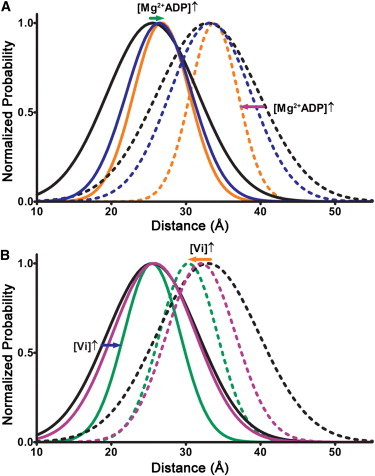
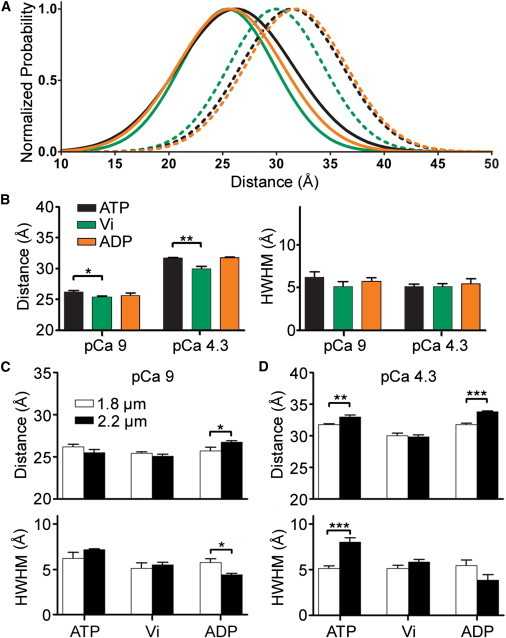
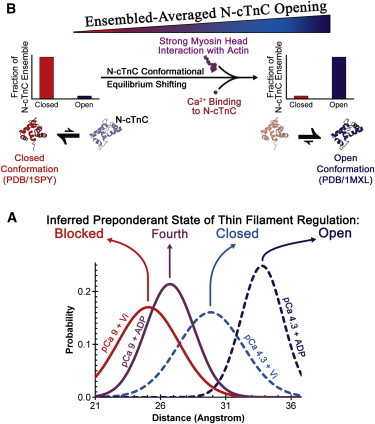
During cardiac thin-filament activation, the N-domain of cardiac troponin C (N-cTnC) binds to Ca(2+) and interacts with the actomyosin inhibitory troponin I (cTnI). The interaction between N-cTnC and cTnI stabilizes the Ca(2+)-induced opening of N-cTnC and is presumed to also destabilize cTnI-actin interactions that work together with steric effects of tropomyosin to inhibit force generation. Recently, our in situ steady-state FRET measurements based on N-cTnC opening suggested that at long sarcomere length, strongly bound cross-bridges indirectly stabilize this Ca(2+)-sensitizing N-cTnC-cTnI interaction through structural effects on tropomyosin and cTnI. However, the method previously used was unable to determine whether N-cTnC opening depends on sarcomere length. In this study, we used time-resolved FRET to monitor the effects of cross-bridge state and sarcomere length on the Ca(2+)-dependent conformational behavior of N-cTnC in skinned cardiac muscle fibers. FRET donor (AEDANS) and acceptor (DDPM)-labeled double-cysteine mutant cTnC(T13C/N51C)AEDANS-DDPM was incorporated into skinned muscle fibers to monitor N-cTnC opening. To study the structural effects of sarcomere length on N-cTnC, we monitored N-cTnC opening at relaxing and saturating levels of Ca(2+) and 1.80 and 2.2-μm sarcomere length. Mg(2+)-ADP and orthovanadate were used to examine the structural effects of noncycling strong-binding and weak-binding cross-bridges, respectively. We found that the stabilizing effect of strongly bound cross-bridges on N-cTnC opening (which we interpret as transmitted through related changes in cTnI and tropomyosin) become diminished by decreases in sarcomere length. Additionally, orthovanadate blunted the effect of sarcomere length on N-cTnC conformational behavior such that weak-binding cross-bridges had no effect on N-cTnC opening at any tested [Ca(2+)] or sarcomere length. Based on our findings, we conclude that the observed sarcomere length-dependent positive feedback regulation is a key determinant in the length-dependent Ca(2+) sensitivity of myofilament activation and consequently the mechanism underlying the Frank-Starling law of the heart.


Figures

Figure 1
Figure 1
Comparison of N-cTnC Cys-13–Cys-51 distance distributions as a function of cTnC site-II Ca2+ occupancy and cross-bridge binding state when observed at long 2.2-μm SL in cTnC(T13C/N51C)AEDANS-DDPM-reconstituted myocardial fibers. (A) (Upper panel) Representative trace (black dots) of the in situ total fluorescence intensity decay of FRET donor AEDANS in the presence of nonfluorescent acceptor DDPM, which was measured at 2.2-μm SL in the presence of Ca2+ (pCa 4.3) under normal cross-bridge cycling. The decay profile was fit with Eq. 1 (gray line). (Inset and lower panel) Autocorrelation function and residuals associated with the fitting, respectively, which were used to judge goodness of fit. (B) Normalized distance distributions obtained using global-curve analysis of intensity decay profiles observed under the following conditions: pCa 9 + ATP (black solid line), pCa 4.3 + ATP (black dotted line), pCa 9 + ADP (orange solid line), pCa 4.3 + ADP (orange dotted line), pCa 9 + Vi (green solid line), and pCa 4.3 + Vi (green dotted line). (Area normalized versions of these distance distributions are shown in Fig. S4 in the Supporting Material.) (C) As a function of whether Ca2+ is bound to N-cTnC, this panel shows the statistical significance of changes in r and HWHM that occurred because of changes in pCa level or cross-bridge binding state. Parameter values are reported as the mean ± SE. p < 0.05; ∗∗p < 0.005; ∗∗∗p < 0.001.
Figure 2
Figure 2
Cys-13–Cys-51 distance distributions calculated from intensity decays observed in cTnC(T13C/N51C)AEDANS- and cTnC(T13C/N51C)AEDANS-DDPM-reconstituted fibers set to 2.2 μm SL and exposed to intermediate and saturating concentrations of ADP and Vi. Similar to Fig. 1, the distance distributions were normalized against their peaks (area-normalized versions are shown in Fig. S5), and solid lines and dashed lines indicate measurements taken at pCa 9 and pCa 4.3, respectively. (A) Structural effects of 2.5 mM Mg2+-ADP (blue lines) versus 5 mM Mg2+-ADP (orange lines). For the purpose of visual comparison, distance distributions measured in presence of 5 mM ATP (black lines) are also plotted. (Green and purple arrows) How distance distributions change in response to increasing [Mg2+-ADP]. (B) Similarly to panel A, the structural effects of 0.5 mM Vi (purple lines) versus 1.0 mM Vi (0.5 mM, green lines) are shown. (Blue and orange arrows) How distance distributions change in response to increasing [Vi].
Figure 3
Figure 3
Comparison of N-cTnC Cys-13–Cys-51 distance distributions as a function of cTnC site-II Ca2+-occupancy and cross-bridge state when observed at short 1.8-μm SL in cTnC(T13C/N51C)AEDANS-DDPM-reconstituted myocardial fibers. (A) Normalized distance distributions obtained using global-curve analysis of intensity decay profiles observed under the following conditions: pCa 9 + ATP (black solid line), pCa 4.3 + ATP (black dotted line), pCa 9 + ADP (orange solid line), pCa 4.3 + ADP (orange dotted line), pCa 9 + Vi (green solid line), and pCa 4.3 + Vi (green dotted line). (Area-normalized versions of these distance distributions are shown in Fig. S6.) (B) As a function of whether Ca2+ is bound to N-cTnC and at 1.8 μm SL, this panel shows the statistical significance of differences in r and HWHM values that occurred because of changes in cross-bridge binding state. (C and D) Significance of differences in r and HWHM due to reduction of SL. The number of determinations was 5–6 for each group. p < 0.05; ∗∗p < 0.005; ∗∗∗p < 0.001.
Figure 4
Figure 4
A schematic presenting our model for how changes in N-cTnC Ca2+ site-II occupancy and cross-bridge state lead to changes in ensemble-averaged N-cTnC opening at 2.2 μm SL. (A) Shown here are selected area-normalized distance distributions, which each represent a different a preponderant state of the four states of thin-filament regulation (27), as based on cTnC site-II Ca2+ occupancy and cross-bridge binding state. Hence, in terms of the preponderant state of thin-filament regulation, the extent of ensemble-averaged N-cTnC opening is ranked in the following order: Blocked < Fourth < Closed < Open. (B) We interpret the observed changes in ensemble-averaged N-cTnC opening as caused by shifts in an N-cTnC conformational equilibrium that is at work during thin-filament regulation. As explained further in the main text, Ca2+ binding to N-cTnC and strong cross-bridge binding to actin can each independently and allosterically lead to a shift in this equilibrium from the closed conformation of N-cTnC toward the open conformation. However, Ca2+ binding to N-cTnC and strong actomyosin interactions work in concert during physiological thin-filament regulation, and both are required to maximally activate the thin-filament and concomitantly shift the N-cTnC equilibrium toward the open conformation. The structures of N-cTnC presented in panel B were from PDB:1SPY (53) and PDB:1MXL (4), as indicated.

Comment in

References

    1. Tobacman L.S. Thin filament-mediated regulation of cardiac contraction. Annu. Rev. Physiol. 1996;58:447–481. - PubMed
    1. Gordon A.M., Homsher E., Regnier M. Regulation of contraction in striated muscle. Physiol. Rev. 2000;80:853–924. - PubMed
    1. Wei B., Jin J.P. Troponin T isoforms and posttranscriptional modifications: Evolution, regulation and function. Arch. Biochem. Biophys. 2011;505:144–154. - PMC - PubMed
    1. Li M.X., Spyracopoulos L., Sykes B.D. Binding of cardiac troponin-I147-163 induces a structural opening in human cardiac troponin-C. Biochemistry. 1999;38:8289–8298. - PubMed
    1. Dong W.J., Xing J., Cheung H.C. Conformation of the regulatory domain of cardiac muscle troponin C in its complex with cardiac troponin I. J. Biol. Chem. 1999;274:31382–31390. - PubMed

Publication types