. 2015 Feb;87(2):332-42.
doi: 10.1038/ki.2014.270. Epub 2014 Aug 6.

Innate immunity pathways regulate the nephropathy gene Apolipoprotein L1

Affiliations

Innate immunity pathways regulate the nephropathy gene Apolipoprotein L1

Brendan Nichols et al. Kidney Int. 2015 Feb.

Abstract

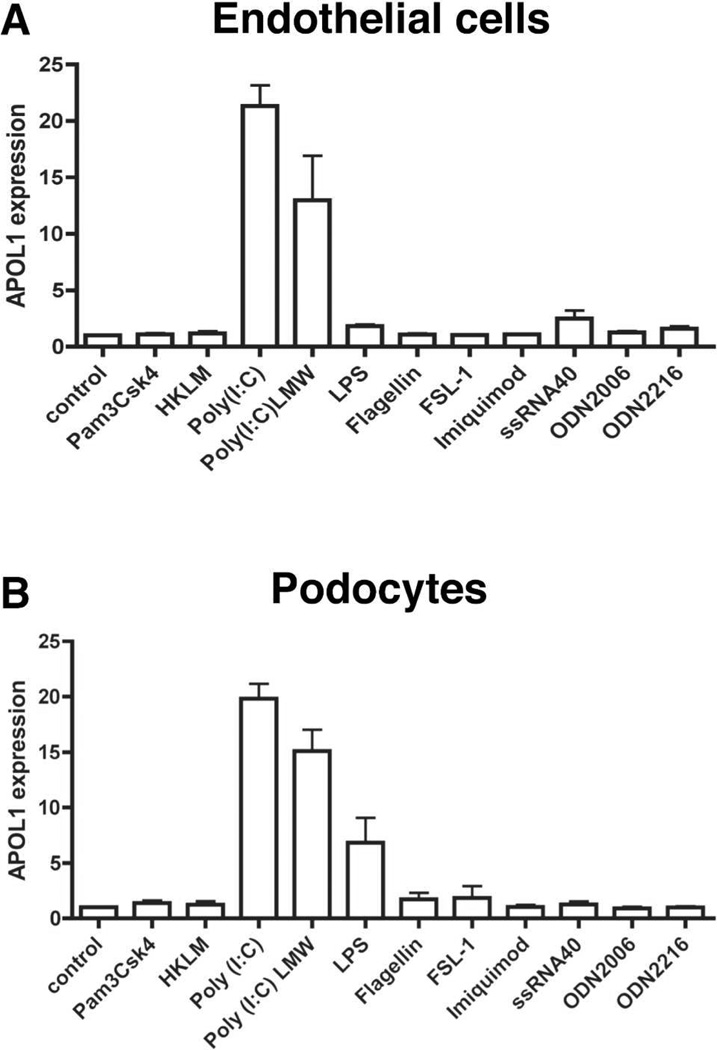
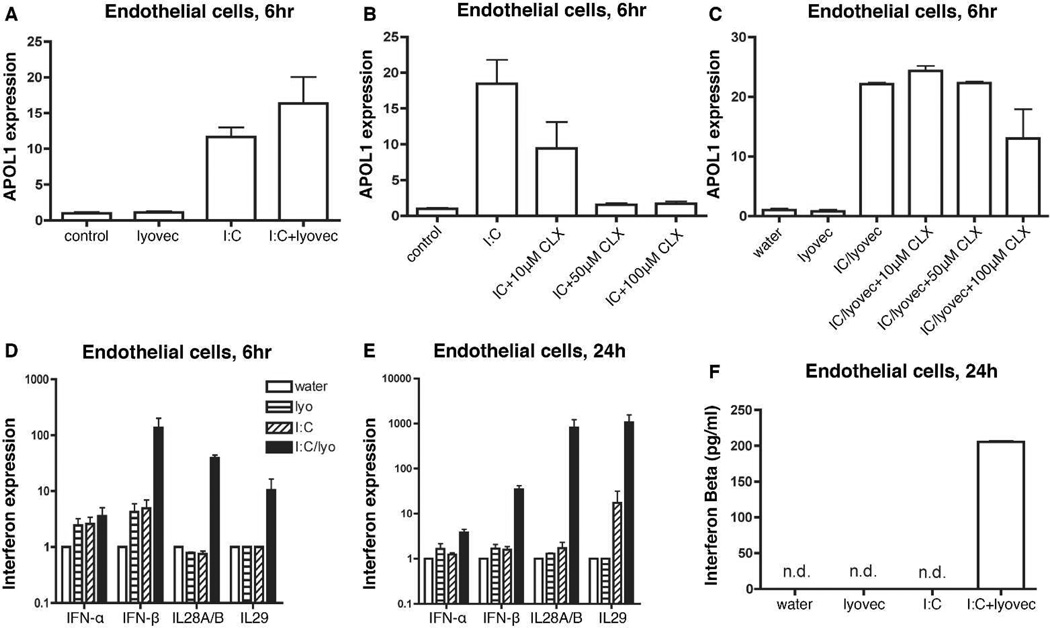
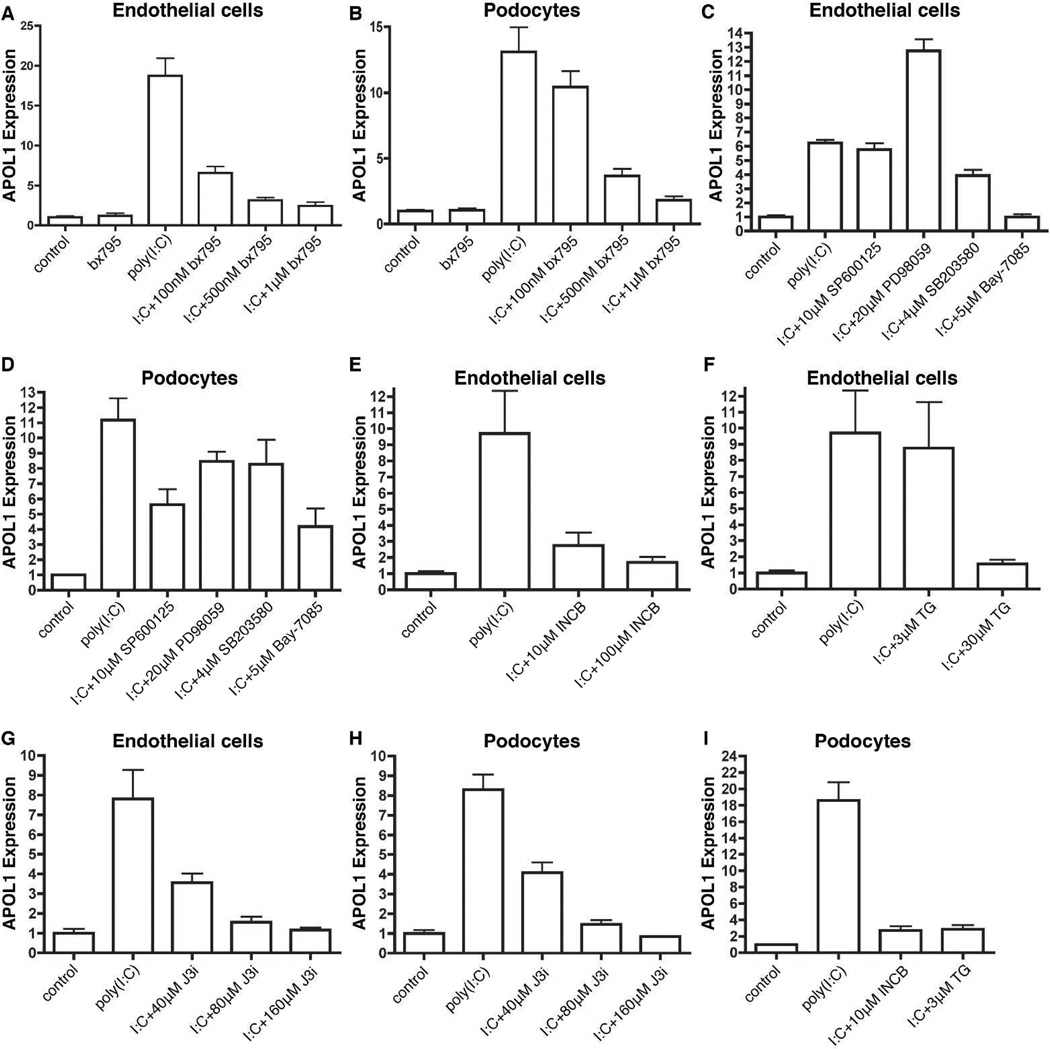
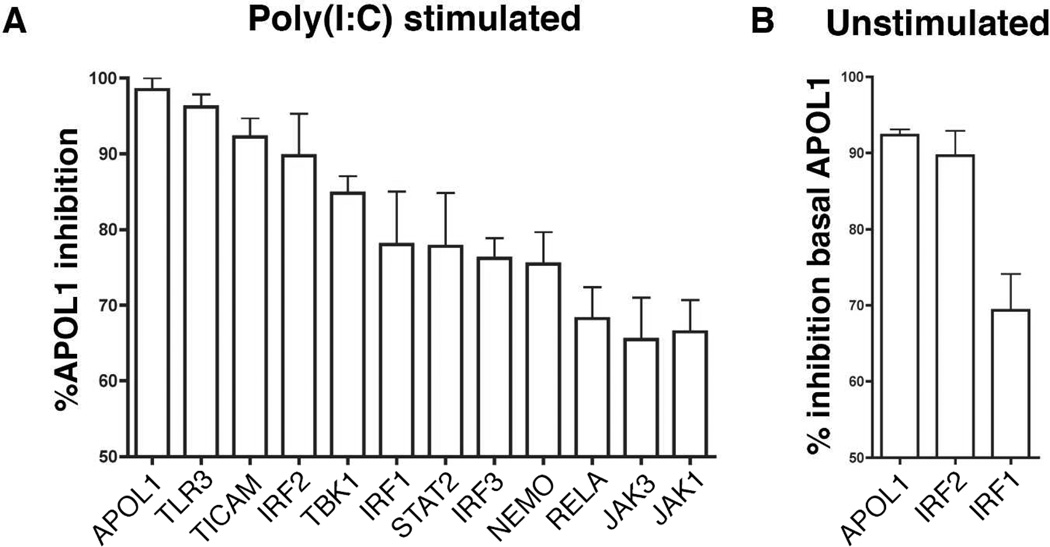
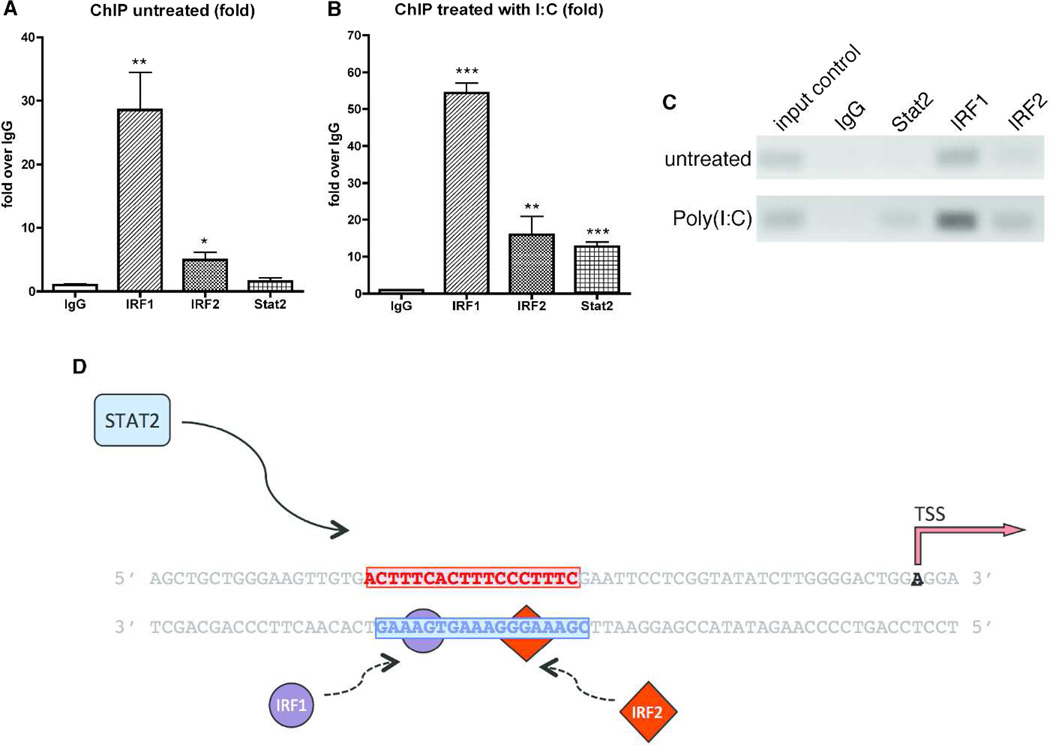
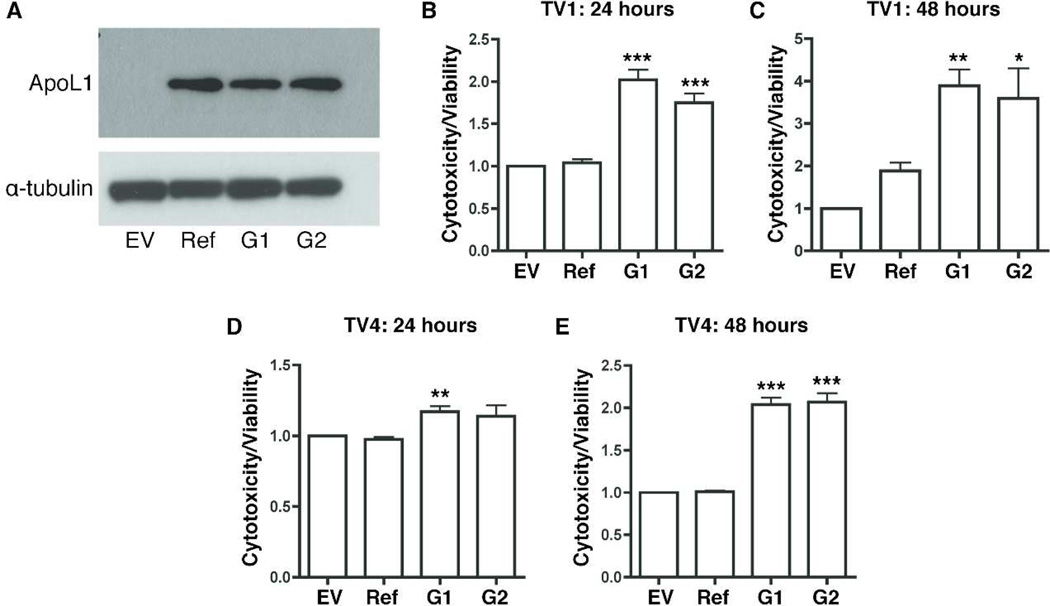
Apolipoprotein L1 (APOL1) risk variants greatly elevate the risk of kidney disease in African Americans. Here we report a cohort of patients who developed collapsing focal segmental glomerulosclerosis while receiving therapeutic interferon, all of whom carried the APOL1 high-risk genotype. This finding raised the possibility that interferons and the molecular pattern recognition receptors that stimulate interferon production may contribute to APOL1-associated kidney disease. In cell culture, interferons and Toll-like receptor (TLR) agonists increased APOL1 expression by up to 200-fold, in some cases with the appearance of transcripts not detected under basal conditions. PolyI:C, a double-stranded RNA TLR3 agonist, increased APOL1 expression by upregulating interferons directly or through an interferon-independent, IFN-regulatory factor 3 (IRF3)-dependent pathway. Using pharmacological inhibitors, small hairpin RNA knockdown, and chromatin immunoprecipitation, we found that the interferon-independent TLR3 pathway relied on signaling through TBK1, NF-κB, and Jak kinases, and on binding of IRF1, IRF2, and STAT2 at the APOL1 transcription start site. We also demonstrate that overexpression of the APOL1 risk variants is more injurious to cells than overexpression of the wild-type APOL1 protein. Our study illustrates that antiviral pathways may be important inducers of kidney disease in individuals with the APOL1 high-risk genotype and identifies potential targets for prevention or treatment.


Conflict of interest statement

Conflict of Interest Disclosure:

David Friedman and Martin Pollak are co-inventors on patents filed by Beth Israel Deaconess Medical Center related to APOL1 diagnostics and therapeutics.

Figures

Figure 1
Figure 1
Interferons induce APOL1 expression and appearance of additional transcript variants. Normalized expression of APOL1 (to 18S subunit) in (A) Human Coronary Artery Endothelial Cells (HCAEC) or (B) podocytes after stimulation with α (100U/ml), β (100U/ml), or γ(10ng/ml) interferon. Values are mean fold increase in APOL1 mRNA +/− s.e.m for a minimum of 3 experiments. (C) Under basal conditions in HCAEC, only APOL1 transcript variant (tv) 1 was detected by PCR. After stimulation with Interferon γ, tv2 and tv4 were also detected at time points indicated. N-terminal amino acid sequences encoded by the transcript variants are shown at right. Red caret indicates predicted signal sequence cleavage site present in tv1, but absent from tv4. The site in tv2 may be too far from the N-terminus to promote cleavage. (D) Western blot of APOL1 protein in whole cell lysate 24 hours after stimulation with polyI:C (10µg/ml) or interferons (α-100U/ml, β-100U/ml, or γ-10ng/ml) in endothelial cells and podocytes. (E) APOL1 staining was not observed in untreated (control) endothelial cells. APOL1 staining (green) is strong after 24 hours of interferon γ treatment and can be abolished by APOL1 siRNA knockdown. Nuclei are stained by DAPI (blue).
Figure 2
Figure 2
The TLR3 agonist PolyI:C upregulates APOL1 expression. Normalized APOL1 expression (to 18S subunit) measured by real-time RT-PCR in (A) HCAEC or (B) podocytes after 24 hours of stimulation by the indicated agonists for the specified TLRs. Values are fold increase in APOL1 mRNA/18S mRNA expression for 3 experiments +/− s.e.m. TLR1/2: Pam3cSK4 (triacylated lipoprotein), 1µg/ml; TLR2: HKLM (derived from heat-killed Listeria), 108 cells/ml; TLR3: poly(I:C), low (0.2–1kb) or high (1.5–8kb) molecular weight, 10µg/ml; TLR4: Lipopolysaccharide (LPS), 1µg/ml, TLR5: Flagellin, 1µg/ml; TLR6/2: FSL1 (diacylated lipoprotein), 1µg/ml; TLR7: Imiquimod, 2µg/ml; TLR8: ssRNA40/Lyovec, 2µg/ml; TLR9: ODN compounds (unmethylated CpG synthetic oligos), 1µM.
Figure 3
Figure 3
PolyI:C induces APOL1 expression through parallel pathways. (A) Non-transfected (10µg/ml) and Lyovec-transfected polyI:C (10µg/ml) increase APOL1 mRNA expression in endothelial cells (A) to similar degrees; data for later time points and for podocytes is shown in supplementary figure 2. (B,C) Chloroquine (CLX) treatment blocks APOL1 induction endothelial cells by non-transfected polyI:C (B) but not by transfected polyI:C (C) in endothelial cells. (D–F) Endothelial cells were treated with non-transfected polyI:C (I:C) or transfected polyI:C (I:C/lyo) and fold increases of IFN-α, -β, or –λ (IL28A/B, IL29) mRNA were measured by real time RT-PCR at 6 or 24 hours. IFN-γ was not detected under any conditions. (F) ELISA confirmed mRNA results in (H) for interferon-β (interferon-α was undetectable in all conditions, not shown). In summary, transfected polyI:C is a potent inducer of interferons whereas non-transfected polyI:C has minimal effects on classical interferon production. (n.d.: not detectable).
Figure 4
Figure 4
Induction of APOL1 in endothelial cells and podocytes by polyI:C is blocked by TBK1/IKKε, Jak, NF-kB, and MAP kinase inhibitors. In all subfigures, cells were pretreated with drug and stimulated with 10µg/ml of polyI:C with normalized APOL1 expression measured by real-time RT-PCR. (A,B) In endothelial cells and podocytes, the TBK1/IKKε inhibitor bx795 blocks APOL1 upregulation. (C,D) Blockade of APOL1 upregulation by inhibitors of NF-kB (Bay-7085), JNK (SP600125), p38 (SB203580), and ERK (PD98059) in endothelial cells (C) and podocytes (D). (E–I) In endothelial cells and podocytes, APOL1 stimulation was blocked to varying degrees by (E, I) the Jak1/2 inhibitor INCB018424, (F,I) the Jak2 inhibitor TG101348, (G,H) the Jak3 specific inhibitor WHI-P131 (J3i).
Figure 5
Figure 5
shRNA knockdown of several downstream components of the TLR3 pathway block APOL1 stimulation by polyI:C. (A) APOL1 upregulation in HCAEC after stimulation with polyI:C (10µg/ml) was inhibited by pretreatment with shRNA against TLR signaling pathway components. (B) Of the shRNA that blunted APOL1 upregulation by polyI:C, only shRNAs against IRF1 and IRF2 reduced the amount of basal APOL1 expression. p<0.01 for all shRNA shown vs. control shRNA. N = 3–7.
Figure 6
Figure 6
Chromatin Immunoprecipitation (ChIP) validates transcription factor binding at the APOL1 locus. (A) Transcription factor binding of IRF1, IRF2, and STAT2 to the APOL1 promoter in lysates from endothelial cells under basal conditions, as measured by real time PCR at the APOL1 promoter (N=5). (B) Transcription factor binding of IRF1, IRF2, and STAT2 to the APOL1 promoter in lysates from endothelial cells 6 hours after stimulation with 10µg/ml polyI:C, as measured by real time PCR (N=5). (C) Results of representative ChIP experiment using standard PCR. (D) IRF1 and IRF2 bind to a canonical IRF binding site (blue box) near the APOL1 transcription start site (TSS) under basal conditions and their binding increases after polyI:C stimulation. Sequence amplified in ChIP experiments is shown. STAT2 does not bind detectably under basal conditions, but is recruited to the promoter after stimulation with polyI:C. STAT2 may bind the interferon stimulated response element (red box) as part of a STAT1/STAT2/IRF9 complex in the absence of direct interferon stimulation. *p<0.01, **p<0.001, or ***p<0.0001 vs IgG.
Figure 7
Figure 7
Kidney risk variants of APOL1 are more toxic to HEK293 cells than “wild-type” APOL1. (A) Plasmids encoding Reference hg19 (Ref) APOL1, the G1 risk variant (with S342G and I384M), the G2 risk variant (del388N389Y), or empty vector (EV) were transfected into HEK293 cells. Equal expression was noted by immunoblot at 24 hours (shown for transcript variant 1). (B–E) The ratio of cytotoxicity:viability was measured 24 (B,D) or 48 (C,E) hours after transfection with APOL1 transcript variant 1 (B,C) or transcript variant 4 (D,E). Data from different experiments were normalized using EV values. *p<0.05, **p<0.005, or ***p<0.0001 versus Reference APOL1. N=7 for panel B, 5 for panel C, 4 for panels D,E.

Comment in

References

    1. Genovese G, Friedman DJ, Ross MD, et al. Association of trypanolytic ApoL1 variants with kidney disease in African Americans. Science. 2010;329:841–845. - PMC - PubMed
    1. Tzur S, Rosset S, Shemer R, et al. Missense mutations in the APOL1 gene are highly associated with end stage kidney disease risk previously attributed to the MYH9 gene. Hum Genet. 2010;128:345–350. - PMC - PubMed
    1. Friedman DJ, Kozlitina J, Genovese G, et al. Population-based risk assessment of APOL1 on renal disease. J Am Soc Nephrol. 2011;22:2098–2105. - PMC - PubMed
    1. Kopp JB, Nelson GW, Sampath K, et al. APOL1 genetic variants in focal segmental glomerulosclerosis and HIV-associated nephropathy. J Am Soc Nephrol. 2011;22:2129–2137. - PMC - PubMed
    1. Smith EE, Malik HS. The apolipoprotein L family of programmed cell death and immunity genes rapidly evolved in primates at discrete sites of host-pathogen interactions. Genome Res. 2009;19:850–858. - PMC - PubMed

Publication types

MeSH terms