. 2014 Oct 6;11(99):20140570.
doi: 10.1098/rsif.2014.0570.

Observation of the molecular organization of calcium release sites in fast- and slow-twitch skeletal muscle with nanoscale imaging

Affiliations

Observation of the molecular organization of calcium release sites in fast- and slow-twitch skeletal muscle with nanoscale imaging

Isuru D Jayasinghe et al. J R Soc Interface. .

Abstract

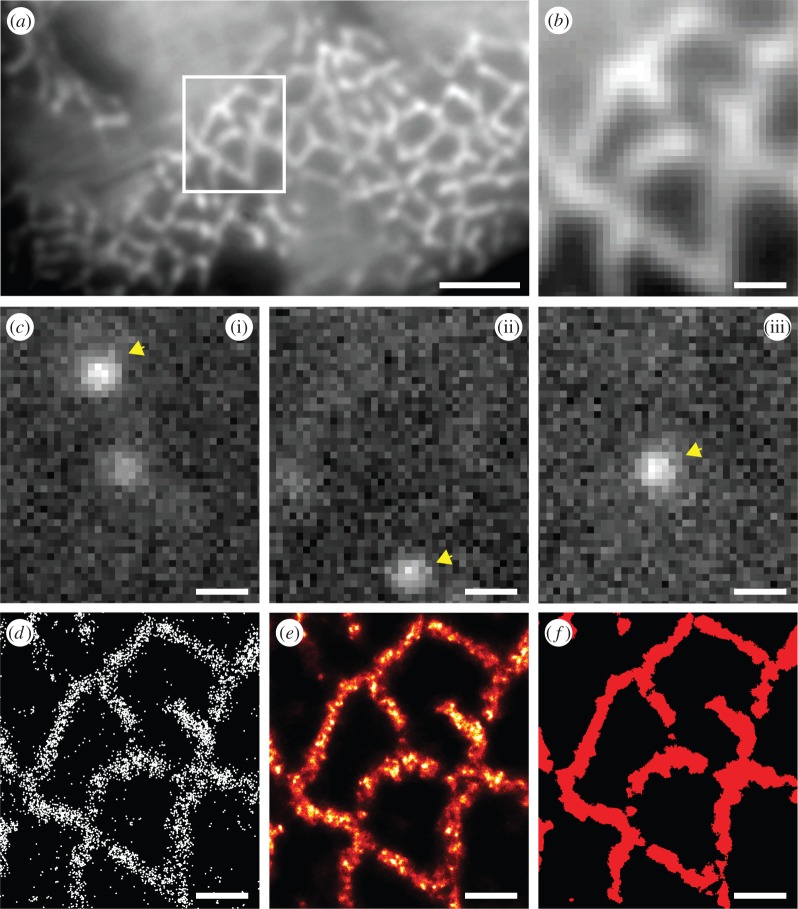
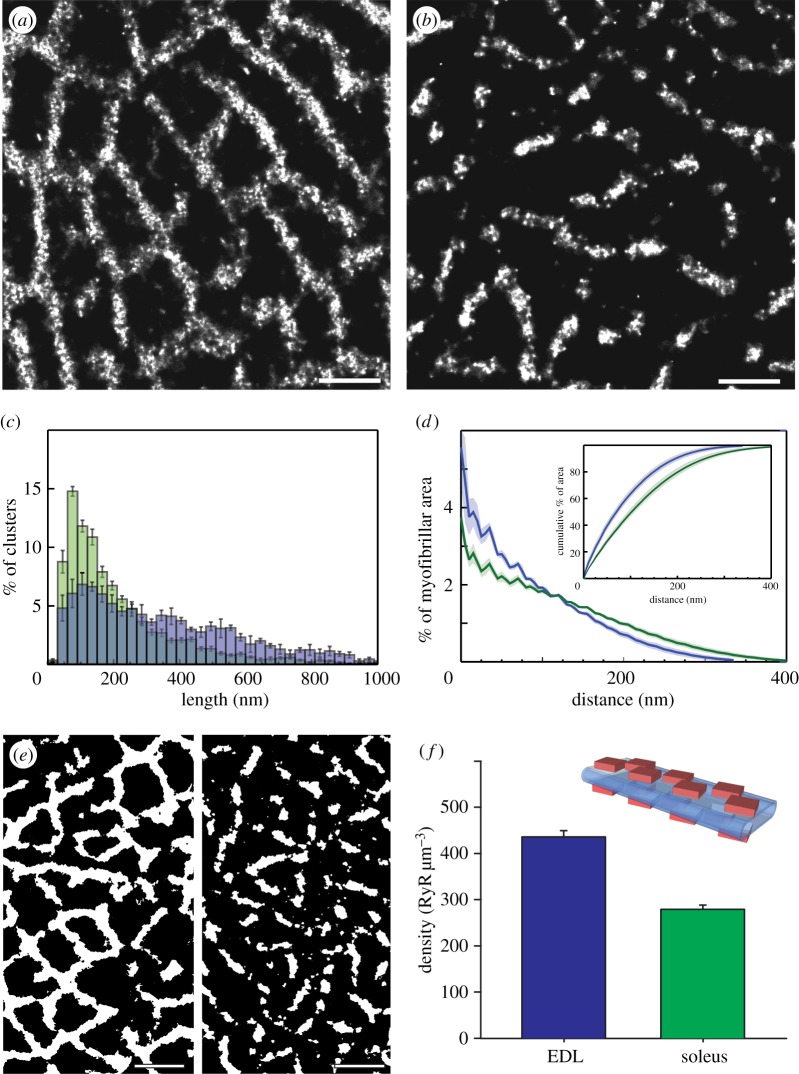
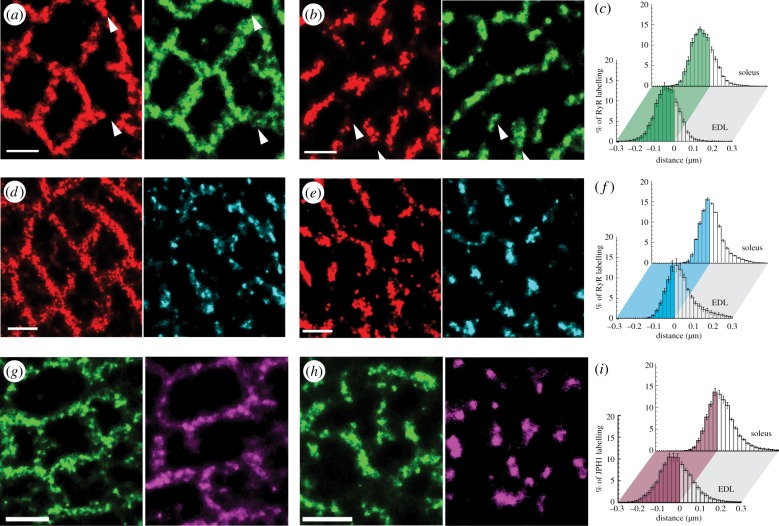
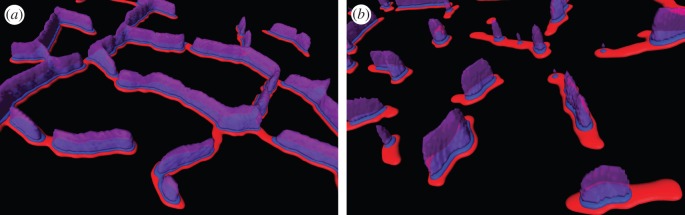
Localization microscopy is a fairly recently introduced super-resolution fluorescence imaging modality capable of achieving nanometre-scale resolution. We have applied the dSTORM variation of this method to image intracellular molecular assemblies in skeletal muscle fibres which are large cells that critically rely on nanoscale signalling domains, the triads. Immunofluorescence staining in fixed adult rat skeletal muscle sections revealed clear differences between fast- and slow-twitch fibres in the molecular organization of ryanodine receptors (RyRs; the primary calcium release channels) within triads. With the improved resolution offered by dSTORM, abutting arrays of RyRs in transverse view of fast fibres were observed in contrast to the fragmented distribution on slow-twitch muscle that were approximately 1.8 times shorter and consisted of approximately 1.6 times fewer receptors. To the best of our knowledge, for the first time, we have quantified the nanometre-scale spatial association between triadic proteins using multi-colour super-resolution, an analysis difficult to conduct with electron microscopy. Our findings confirm that junctophilin-1 (JPH1), which tethers the sarcoplasmic reticulum ((SR) intracellular calcium store) to the tubular (t-) system at triads, was present throughout the RyR array, whereas JPH2 was contained within much smaller nanodomains. Similar imaging of the primary SR calcium buffer, calsequestrin (CSQ), detected less overlap of the triad with CSQ in slow-twitch muscle supporting greater spatial heterogeneity in the luminal Ca2+ buffering when compared with fast twitch muscle. Taken together, these nanoscale differences can explain the fundamentally different physiologies of fast- and slow-twitch muscle.

Keywords: junctophilin; localization microscopy; ryanodine receptor; skeletal muscle.


Figures

Figure 1.
Figure 1.
Single-molecule localization and visualization in dSTORM of skeletal muscle sections. (a) An example of RyR labelling in a transverse section of a rat EDL visualized through HiLo widefield fluorescence [22]. (b) Magnified view of the region in panel (a) indicated by the box. (c)(i–iii) Flashes of fluorescence (arrowheads) corresponding to single-molecule photoswitching within the same region that were localized. (d) Indicated with the white dots, are the positions of localized single-molecule events. (e) These localization data could also be rendered into greyscale images using the algorithm previously described by Baddeley et al. [24] where intensity was proportional to the local event density. (f) For binarization of these data, Delaunay triangulation was performed on the point data. Triangles longer than the effective image resolution (30 nm) were discarded while shorter triangles were merged into a binary mask that reliably captured areas of positive labelling. These binary masks were used for both the area-based RyR density analysis and the co-localization analyses presented in the manuscript. For details on the co-localization analysis method, see supporting material by Jayasinghe et al. [14]. Scale bars, (a) 1 mm, (bf) 250 nm. (Online version in colour.)
Figure 2.
Figure 2.
Comparison between the RyR distributions in fast- and slow-twitch fibres. dSTORM transverse images of EDL (a) and SOL (b) fibres labelled for RyR. Note the fragmented morphology of RyR staining in SOL compared with the highly continuous morphology in EDL. (c) This morphology and the differences in the cross-sectional fibre area containing RyRs are compared using binary masks of the dSTORM data of EDL (left) and SOL (right). (d) Percentage histogram analysis of the lengths of the RyR segments in EDL (blue) and SOL fibres (green). (e) Histograms of the percentage of transverse myofibrillar area as a function of the distance to the edge of RyR-labelled regions in EDL (blue) and SOL fibres (green). The inset shows the cumulative histogram of the same analysis where approximately 95% of the myoplasmic area is within 200 nm and 300 nm of RyRs in EDL and SOL respectively (shaded intervals indicate s.e.m.). (f) The mean values of the densities of RyR within triads show a 1.6-fold higher concentration of RyR within fibres from the EDL muscle (436 RyR µm−3) compared with those in SOL (279 RyR µm−3). The inset is a schematic of the typical double layer geometry of RyRs (red) flanking the flattened t-tubule (blue) within the triads considered in estimating the receptor densities. Scale bars, (a) and (b) 500 nm; (e) 1 µm.
Figure 3.
Figure 3.
Analysis of the spatial relationship between RyR, JPH1, JPH2 and CSQ in fast- and slow-twitch muscle. dSTORM images of RyR (red, left) and the JPH1 (green, right) in a rat (a) EDL and (b) SOL fibres report strong overlap between the two proteins in both muscles. Minor regions of little or no overlap were also observed (arrowheads). (c) Comparison of the histograms of the percentage of RyR staining as a function of the distance to the edge of the nearest region of JPH1 staining in EDL (front) and SOL fibres (back) illustrate 74.98% and 73.15% of RyRs co-localizing with JPH1 respectively (shaded regions of the histogram). dSTORM images of RyR (red, left) and JPH2 (cyan, right) staining in (d) EDL and (e) SOL fibres are shown. Note the distinctly smaller nanodomains within JPH2 staining that contrast with the widespread localization of JPH1 throughout the triads. (f) Shaded regions of the percentage histograms of RyR labelling illustrate that only 35.38% and 49.34% of the RyR is co-localized with JPH2 in EDL (front) and soleus muscle (back). Transverse dSTORM images contrast relative localizations of JPH1 (green, left) and CSQ (cyan, right) in (g) EDL and (h) SOL fibres. Note the clustered morphology of CSQ in SOL versus the more extended CSQ morphology that better follows the JPH1 staining in EDL. (i) The percentage histograms of JPH1 distribution in relation to the edge of CSQ illustrate the consequently smaller triad area consisting of CSQ in SOL (back) compared to EDL (front; 36.76% compared with 46.96%, respectively). Scale bars, (a, b, d, e, g and h) 0.5 µm.
Figure 4.
Figure 4.
Schematic of the organization of RyR, triadin and CSQ in fast- and slow-twitch skeletal muscle. (a) The proposed organization of RyR arrays (red) on one side of the triad forming a mesh-like distribution around the myofibrillar spaces in fast-twitch muscle. Based on co-localization analysis with JPH1, triadin (blue) is expected to overlap with much of the RyR arrays on their luminal side, closely coinciding with CSQ (magenta). (b) In slow-twitch fibres, RyR arrays are seen as comparatively fragmented segments with only a smaller fraction overlapping with triadin and CSQ.

Similar articles

Cited by

References

    1. Schiaffino S, Reggiani C. 2011. Fiber types in mammalian skeletal muscles. Physiol. Rev. 91, 1447–1531. (10.1152/physrev.00031.2010) - DOI - PubMed
    1. Close RI. 1972. Dynamic properties of mammalian skeletal muscles. Physiol. Rev. 52, 129–197. - PubMed
    1. Baylor SM, Hollingworth S. 2003. Sarcoplasmic reticulum calcium release compared in slow-twitch and fast-twitch fibres of mouse muscle. J. Physiol. 551, 125–138. (10.1113/jphysiol.2003.041608) - DOI - PMC - PubMed
    1. Barclay CJ. 2012. Quantifying Ca2+ release and inactivation of Ca2+ release in fast- and slow-twitch muscles. J. Physiol. 590, 6199–6212. (10.1113/jphysiol.2012.242073) - DOI - PMC - PubMed
    1. Fryer MW, Stephenson DG. 1996. Total and sarcoplasmic reticulum calcium contents of skinned fibres from rat skeletal muscle. J. Physiol. 493, 357–370. - PMC - PubMed

Publication types

MeSH terms

LinkOut - more resources