. 2014 Aug 6;34(32):10511-27.
doi: 10.1523/JNEUROSCI.0405-14.2014.

Activation of neuronal NMDA receptors triggers transient ATP-mediated microglial process outgrowth

Affiliations

Activation of neuronal NMDA receptors triggers transient ATP-mediated microglial process outgrowth

Lasse Dissing-Olesen et al. J Neurosci. .

Abstract

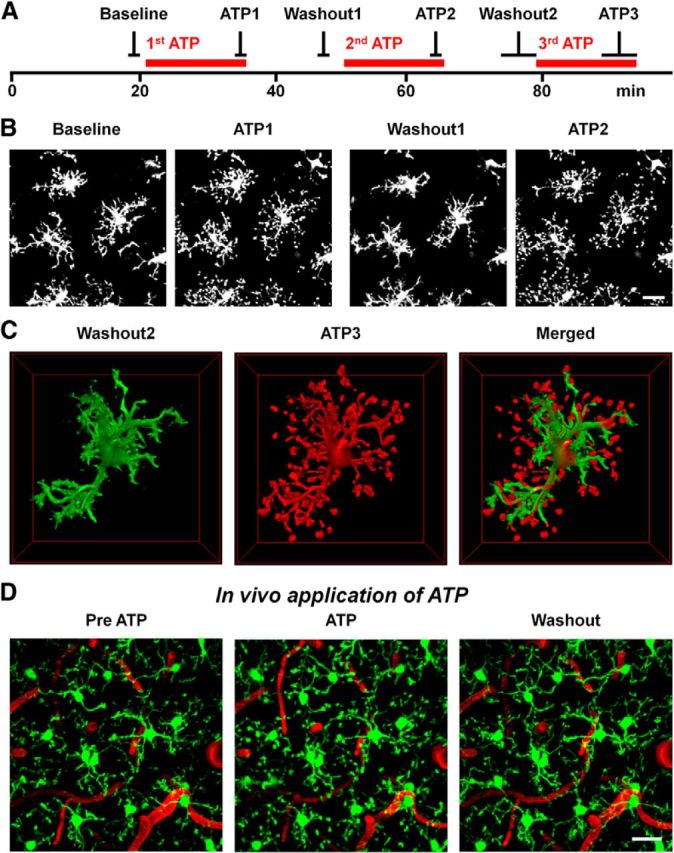
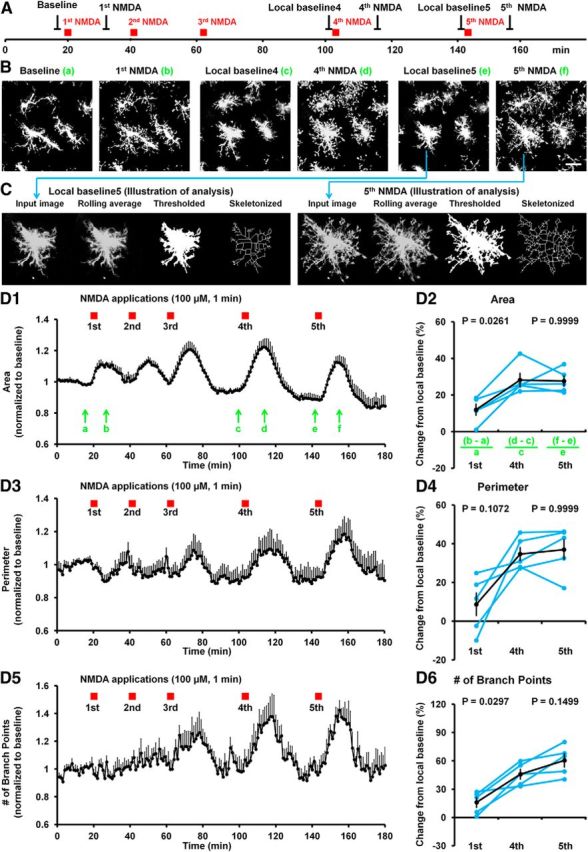
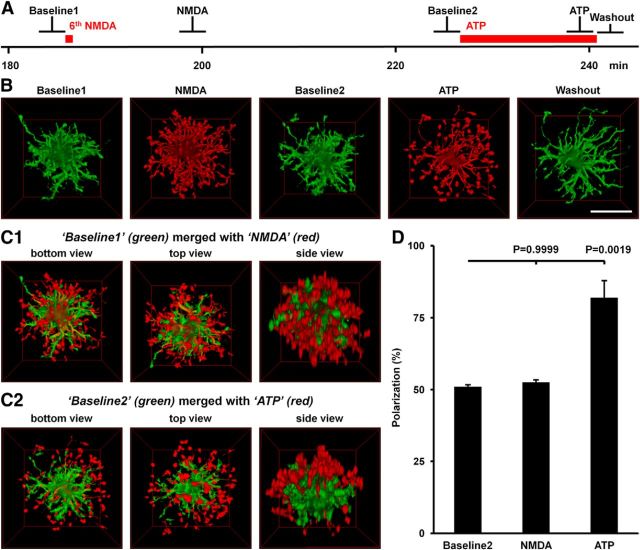
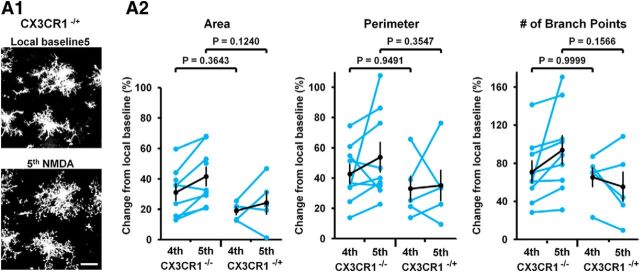
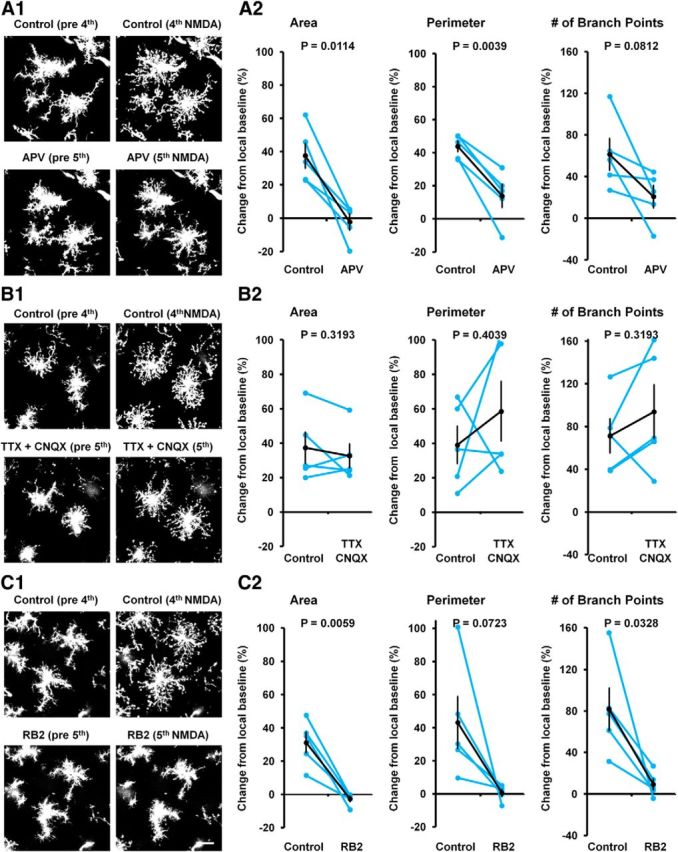
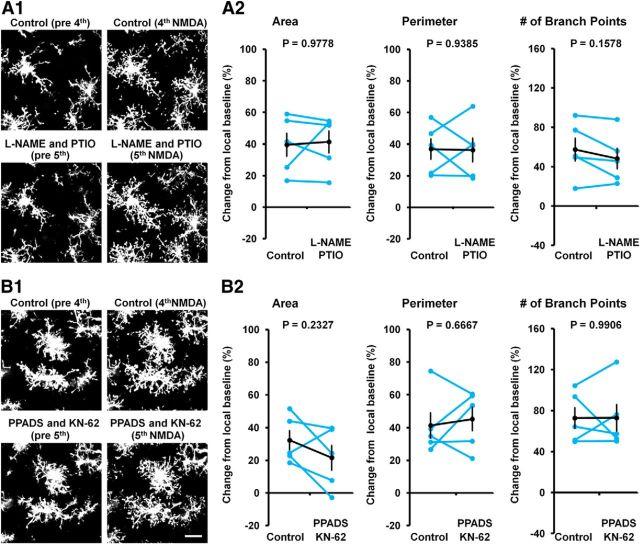
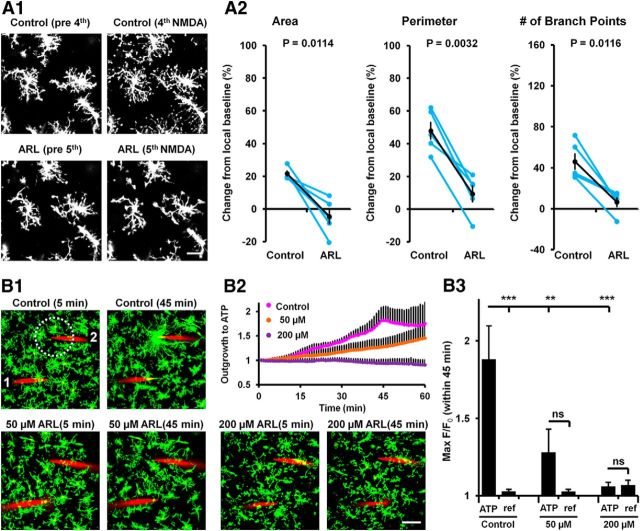
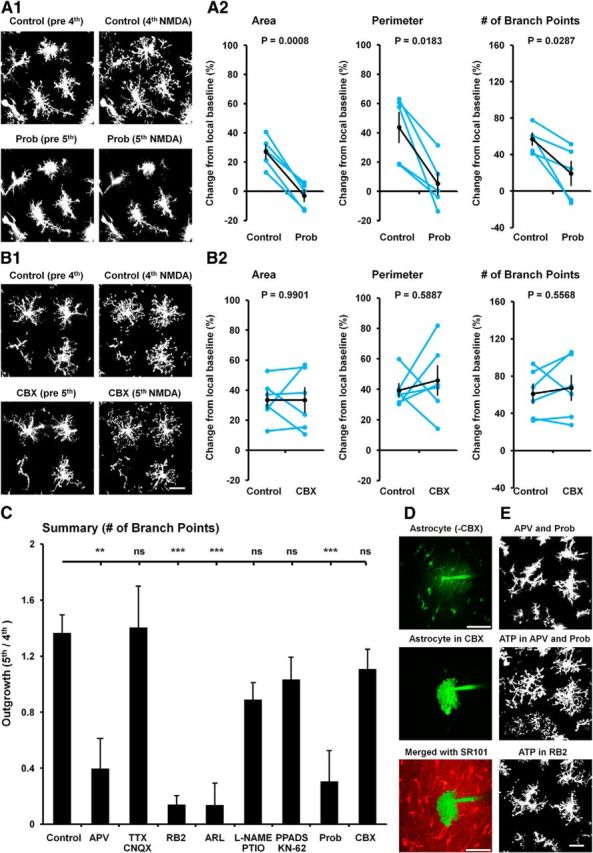
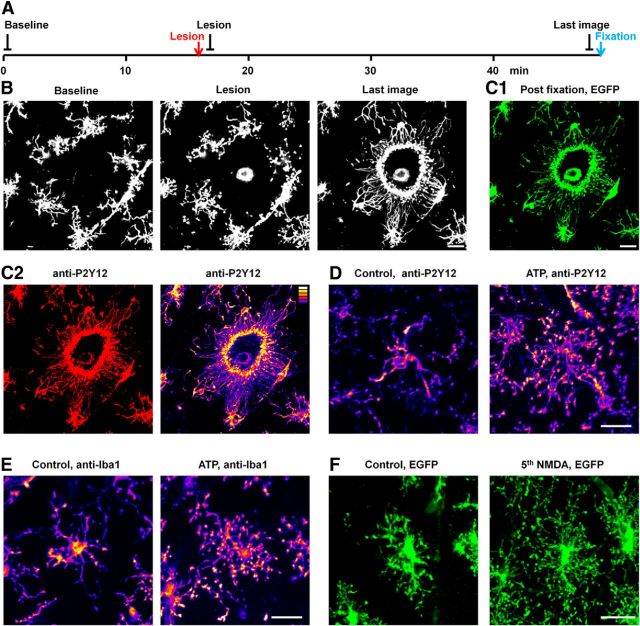
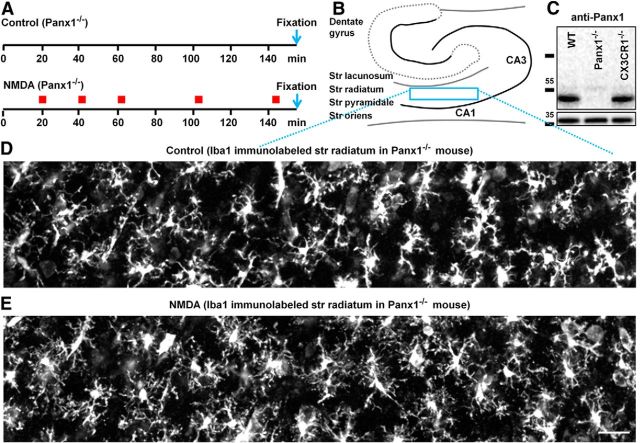
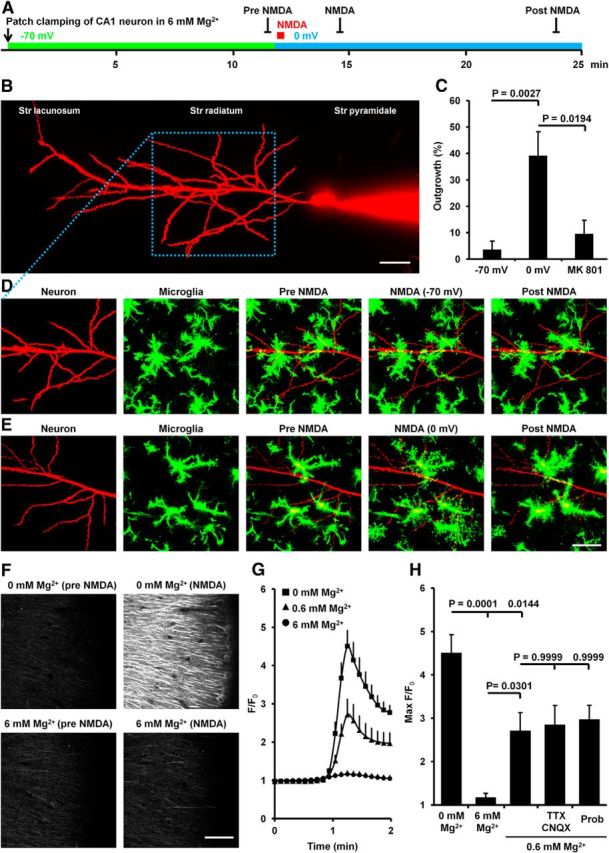
Microglia are morphologically dynamic cells that rapidly extend their processes in response to various stimuli including extracellular ATP. In this study, we tested the hypothesis that stimulation of neuronal NMDARs trigger ATP release leading to communication with microglia. We used acute mouse hippocampal brain slices and two-photon laser scanning microscopy to study microglial dynamics and developed a novel protocol for fixation and immunolabeling of microglia processes. Similar to direct topical ATP application in vivo, short multiple applications of NMDA triggered transient microglia process outgrowth that was reversible and repeatable indicating that this was not due to excitotoxic damage. Stimulation of NMDAR was required as NMDAR antagonists, but not blockers of AMPA/kainate receptors or voltage-gated sodium channels, prevented microglial outgrowth. We report that ATP release, secondary to NMDAR activation, was the key mediator of this neuron-microglia communication as both blocking purinergic receptors and inhibiting hydrolysis of ATP to prevent locally generated gradients abolished outgrowth. Pharmacological and genetic analyses showed that the NMDA-triggered microglia process extension was independent of Pannexin 1, the ATP releasing channels, ATP release from astrocytes via connexins, and nitric oxide generation. Finally, using whole-cell patch clamping we demonstrate that activation of dendritic NMDAR on single neurons is sufficient to trigger microglia process outgrowth. Our results suggest that dendritic neuronal NMDAR activation triggers ATP release via a Pannexin 1-independent manner that induces outgrowth of microglia processes. This represents a novel uncharacterized form of neuron-microglial communication mediated by ATP.

Keywords: ATP purinergic receptors; NMDA glutamate receptors; Pannexin; microglia process motility; synaptic surveillance.


Figures

Figure 1.
Figure 1.
Patterns of microglial process outgrowth induced by ATP in slices and in vivo. A, Time line for image acquisition and ATP applications in slices. B, Bath application of ATP (500 μm; 15 min) induced microglial process outgrowth in slices, which is illustrated by the morphological changes of the cells shown in Baseline versus ATP1. This process outgrowth was reversed when ATP application was terminated (Washout1) and similar morphological changes were observed again with an additional application of ATP (ATP2). Scale bar, 20 μm. C, Color-coded 3D reconstructions of one microglial cell, highlighting the morphological changes induced by ATP (Washout2 in green vs ATP3 in red). Note the ATP-induced extension of existing processes, sprouting of new branches, and formation of bulbous tips that are apparent in red at the Merged image. The images are shown as a bottom view of the x-y plane. Scale bar, 20 μm. D, Microglial process outgrowth in vivo following topical application of ATP (10 mm) to the intact cortex. Note that ATP induced similar morphological changes in vivo as compared within slices that reversed during Washout. Blood vessels are seen in red. Scale bar, 20 μm.
Figure 2.
Figure 2.
Microglial process outgrowth triggered by NMDA was repeatable and reversible. A, Time line for image acquisition during NMDA applications. B, Multiple bath applications of NMDA (100 μm; 1 min/application) consistently triggered microglial process outgrowth illustrated with this series of images obtained at the different time points before and following multiple NMDA applications as indicated in A. The sample images from this time series show that the process outgrowth was reversible after each application and was induced again when NMDA was reintroduced each of these five times. Scale bar, 20 μm. C, Illustration of step-by-step analysis of the microglial cell indicated with the arrows from B. D, Graphic depiction of quantified microglial morphology for different parameters over time with NMDA applications indicated by red markers. D1, D3, D5, Show quantification of the surface area of the thresholded images, the perimeter of the thresholded images, and the number of branch points of the skeletonized images, respectively, with the values normalized to the baseline (average of the first 15 min) and graphed as the mean + SEM. D2, D4, D6, Show the quantification of the morphological changes following the first, fourth, and fifth NMDA applications from the respective local baseline (defined as the 5 min before the respective NMDA application and indicated by a, c, and e in D1) to the max value within 15 min following NMDA application (indicated by b, d, and f in D1). Each data point is represented with a blue dot and data points from the same experiments are connected with blue lines. The mean ± SEM is illustrated in black. The experiments were performed in low Mg2+ (0.6 mm) and in the presents of glycine (10 μm). Repeated-measures ANOVA with Bonferroni's multiple-comparison post-test was used for statistical comparison of the change from local baseline between the groups (n = 5).
Figure 3.
Figure 3.
NMDA triggered a nonpolarized outgrowth of microglia processes in contrast to ATP application. A, Time line for image acquisition to examine NMDA versus ATP-induced outgrowth (note, that this is the sixth NMDA application). B, 3D reconstructions (shown as bottom view, x-y plane) of a microglial cell at five different time points as indicated in A. Note, in Washout (immediately after termination of ATP application) the microglial processes were still extended while the bulbous tips were collapsed. Scale bar, 20 μm. C, Merging of the images before (green) and following (additional portions of the cell are in red) either from NMDA (C1) or ATP application (C2). The merged 3D reconstructions are shown as bottom views (x-y plane), top view (x-y plane), and side views (z-y plane). Note, that outgrowth induced by NMDA-triggered ATP release is nonpolarized (uniform distribution of red bulbous tips) while the red bulbous tips are polarized toward the top (surface of the slice) during ATP application. D, Bar graph depicting the microglial cell polarization in different conditions. The cell's center of mass at Baseline1 was used to determine changes in polarization (total fluorescence above the center of mass/total fluorescence below the center of mass) of the cell at the indicated time points. The groups were compared using repeated-measures ANOVA with Bonferroni's multiple-comparison post-test (n = 3).
Figure 4.
Figure 4.
Outgrowth occurred independently of CX3CR1 expression. Multiple bath applications of NMDA, using the paradigm presented in Figure 2, led to a similar outgrowth in slices from CX3CR1 KO (CX3CR1−/−) and CX3CR1 heterozygous (CX3CR1−/+) mice. A1, Examples of outgrowth following the fifth NMDA application compared with the local baseline5 in a slice from a CX3CR1−/+ mouse. Scale bar, 20 μm. A2, Graphic depiction of changes from the local baseline following the fourth and fifth NMDA application, determined as illustrated in Figure 2, for both CX3CR1−/− and CX3CR1−/+ mice. Each data point is represented with a blue dot and data points from the same experiments are connected with blue lines. The mean ± SEM is illustrated in black. One-way ANOVA with Bonferroni's multiple-comparison post-test was used for statistical comparison of the change from baseline following the fourth NMDA application in CX3CR1−/− and the fourth NMDA application in CX3CR1−/+ mice as well as the fifth NMDA application in CX3CR1−/− and the fifth NMDA application in CX3CR1−/+ mice; n = 9 for CX3CR1−/− (these are separate experiments than those depicted in Fig. 2D) and n = 5 for CX3CR1−/+.
Figure 5.
Figure 5.
NMDA-triggered release of ATP is mediated by NMDA receptors and does not require action potentials or AMPA and kainate receptor stimulation. A–C, Multiple bath applications of NMDA using the paradigm presented in Figure 2 was performed with different pharmacological interventions initiated 25 min before the fifth NMDA application and continued throughout the experiment. A1–C1, Demonstration of microglial morphology shown at different time points (similar to Fig. 2,c–f). Local baselines are referred to as Pre NMDA. Scale bar, 20 μm. A1, Application of the NMDA receptor antagonist APV (100 μm) abolished the outgrowth APV (5th NMDA) compared with APV (pre 5th) versus Control (4th NMDA) compared with Control (pre 4th). B1, Microglial process outgrowth still occurred independently of action potentials, blocked by TTX (1 μm), and AMPA and kainate receptor stimulation, blocked by CNQX (50 μm). C1, Application of the purinergic antagonist RB2 (200 μm) completely abolished microglial process outgrowth. A2–C2, Graphic depiction of changes from the local baseline following the fourth NMDA application Control and the fifth NMDA application in the presence of the indicated pharmacological agents, determined as illustrated in Figure 2. Each data point is represented with a blue dot and data points from the same experiments are connected with blue lines. The mean ± SEM is illustrated in black. A paired t test was used to compare the two groups (n = 5).
Figure 6.
Figure 6.
NMDA-triggered microglial process outgrowth does not depend on NO or ATP-mediated ATP release. A, B, Multiple bath applications of NMDA using the paradigm presented in Figure 2 was performed with different pharmacological interventions before the fifth NMDA application as described in Figure 5. A1–B1, Demonstration of microglial morphology shown at different time points. Local baselines are referred to as Pre NMDA. Scale bar, 20 μm. A1, Application of the NO-synthase blocker L-NG-nitroarginine methyl ester (l-NAME) (1 mm) together with the NO scavenger, PTIO (200 μm), had no effect on NMDA-triggered process outgrowth l-NAME and PTIO (5th NMDA) compared with l-NAME and PTIO (pre 5th) versus Control (4th NMDA) compared with Control (pre 4th). B1, Application of the P2Y1 blocker PPADS (200 μm) together with the P2X7 blocker, KN-62 (15 μm), had no effect on NMDA-triggered process outgrowth PPADS and KN-62 (5th NMDA) compared with PPADS and KN-62 (pre 5th) versus Control (4th NMDA) compared with Control (pre 4th). A2B2, Graphic depiction of changes from the local baseline following the fourth NMDA application Control and the fifth NMDA application in the presence of the indicated pharmacological agents, determined as illustrated in Figure 2. Each data point is represented with a blue dot and data points from the same experiments are connected with blue lines. The mean ± SEM is illustrated in black. A paired t test was used to compare the two groups (n = 5).
Figure 7.
Figure 7.
NMDA-triggered microglial process outgrowth was blocked by inhibiting hydrolysis of ATP. A1, A2, Multiple bath applications of NMDA using the paradigm presented in Figure 2 was performed with application of the ectonucleotidase inhibitor, ARL (50 μm) before the fifth NMDA application. A1, Demonstration of microglial morphology shown at different time points. Local baselines are referred to as Pre NMDA. Scale bar, 20 μm. A2, Application of ARL abolished NMDA-triggered process outgrowth ARL (5th NMDA) compared with ARL (pre 5th) versus Control (4th NMDA) compared with Control (pre 4th). The mean ± SEM is illustrated in black. A paired t test was used to compare the two groups (n = 5). B1, Local application of ATP was used to validate the effect of ARL. Two electrodes was placed 100 μm apart. One electrode (1) contained ACSF and served as a reference while the other electrode (2) contained ACSF with 4 mm ATP. Note the processes surrounding the tip at Control (45 min). B2, Graphic depiction of outgrowth toward the ATP-containing electrodes (measured as F/F0). Note the peak after 45 in control when all the processes have reached the tip of the electrode. B3, Graphic depiction of max F/F0 within the first 45 min demonstrating a significant outgrowth toward the ATP-containing electrode compared with the reference electrode (ref). Fifty micrometer ARL significantly reduced the outgrowth to ATP compared with the outgrowth observed in control 200 μm ALR that completely blocked the directed outgrowth. One-way ANOVA with Bonferroni's multiple-comparison post-test was used for statistical comparison six groups (n = 3); **p < 0.01, ***p < 0.001.
Figure 8.
Figure 8.
NMD- triggered ATP release is sensitive to probenecid (Prob) but is not blocked by the Panx1 inhibitor CBX. A, B, Multiple bath applications of NMDA using the paradigm presented in Figure 2 were performed with different pharmacological interventions before the fifth NMDA application as described in Figure 5. A1, B1, Demonstration of microglial morphology shown at different time points. Local baselines are referred to as Pre NMDA. Scale bar, 20 μm. A1, Application of Prob (2 mm) abolished the outgrowth. Prob (5th NMDA) compared with Prob (pre 5fth) versus Control (4th NMDA) compared with Control (pre 4th). B1, Microglial process outgrowth was not blocked by the potent Panx1 inhibitor, CBX (100 μm). A2, B2, Graphic depiction of changes from the local baseline following the fourth NMDA application Control and the fifth NMDA application in the presence of either Prob or CBX, determined as illustrated in Figure 2. Each data point is represented with a blue dot and data points from the same experiments are connected with blue lines. The mean ± SEM is illustrated in black. A paired t test was used to compare the two groups; n = 5 for A2 and n = 6 for B2. C, Graphic summary of the increase of number of branch points following NMDA-triggered ATP release in the presence of the different pharmacological agents shown in Figures 5A–C, 6, A and B, 7A, and 8, A and B. The increase in number of branch points is presented as the change from local baseline following the fifth NMDA application/the change from local baseline following the fourth NMDA application. The control group consists of the experiments depicted in Figures 2 and 4A (n = 14). One-way ANOVA with Bonferroni's multiple-comparison post-test was used for statistical comparison of the nine groups; **p < 0.01 and ***p < 0.001. D, E, Demonstration of control experiments performed for CBX, APV, Prob, and RB2, respectively. D, In control, (absence of CBX) whole-cell patch clamping of a single astrocyte with a fluorescent dye (Alexa 488, observed in green) inside the patch pipette allowed for dye diffusion through the gap junctions to surrounding astrocytes. However, in the presence of CBX the dye was restricted within the patched astrocyte and thus not observed in the surrounding astrocytes (loaded with sulforhodamine 101, SR101, and observed in red). Scale bar, 50 μm. E, ATP-induced outgrowth still occurred in the presence of both APV and Prob but was blocked by RB2 (same concentration as used with NMDA applications). Scale bar, 20 μm.
Figure 9.
Figure 9.
SNAPSHOT allowed for morphological and immunohistochemical analysis of dynamic processes preserved at specific time points. A, Time line for image acquisition, formation of a lesion (indicated with a red arrow), and the time of fixation (indicated with a blue arrow). B, Example frames from real-time imaging of EGFP+ve microglia over 48 min. The bright circular region in the Lesion image is the lesion area that was induced by exposure of high laser power illumination restricted to this area. Note that the Last image was acquired <1 min before fixation. Scale bar, 50 μm. C1, C2, Morphology of the brain slice that was fixed 30 min after lesioning and immunolabeled using the SNAPSHOT method. C1, Microglial process outgrowth toward the lesion was preserved and could be visualized by imaging of EGFP. C2, Illustration of P2Y12 immunolabeling and pseudocoloring of the nonsaturated labeling intensity [intensity scale for 8-bit image (top right corner); 0 (black), 50, 100, 150, 200, 255 (white)]. The SNAPSHOT protocol allowed us to detect that high levels of P2Y12 receptors were located at the bulbous tips. D, A similar pattern of preferential distribution of P2Y12 immunolabeling to the growing tips was reproduced when SNAPSHOT was applied to preserve the microglial process outgrowth triggered by ATP application (15 min). Note the increased intensity of labeling at the bulbous tips compared with the processes in control conditions. Scale bar, 20 μm. E, A similar pattern of preferential localization at the bulbous tips was also observed with Iba1 immunolabeling of ATP-induced process outgrowth. Scale bar, 20 μm. F, Fixation of brain slices subjected to five NMDA applications demonstrated that NMDA-triggered microglial process outgrowth (fixed 8 min after the fifth NMDA application) can be preserved using the SNAPSHOT method. Scale bar, 20 μm.
Figure 10.
Figure 10.
NMDA-triggered ATP release is independent of Panx1 expression. A, Time line for NMDA applications (indicated with red markers) and time of fixation (indicated by blue arrows) compared with matched controls with no NMDA applications. B, Schematic showing the portion of the hippocampal CA1 region that was analyzed for morphological changes of microglia. C, Western blots of hippocampal brain slice homogenates obtained from Panx1-deficient mice (on C57BL/6 background; Panx1−/−), C57BL6 wild-type mice (WT), and CX3CR1EGFP/EGFP mice (on BALB/c background; CX3CR1−/−) were stained with Panx1 antibodies (Panx1 expected size 48 kDa) and reprobed with antibodies against GAPDH (expected size 37 kDa). D, E, Using our protocol (SNAPSHOT) the microglial morphology at the time of fixation was preserved and visualized by Iba1 immunolabeling. D, Illustration of the microglia morphology in a horizontal cross section of the stratum (Str) radiatum in the CA1 in a control slice from a Panx1−/− mouse that was not subjected to NMDA applications. E, Illustration of the change in microglia morphology in a slice (from the same Panx1−/− mouse shown in D) that was subjected to five NMDA applications, using the paradigm presented in A, and fixed 8 min after the fifth NMDA application. Scale bars: 50 μm.
Figure 11.
Figure 11.
Microglial process outgrowth is triggered by selective NMDAR activation on a single neuron. A, Time line for patch clamping, image acquisition, and depolarization during NMDA application. B, Illustration of the morphology of a patch-clamped CA1 neuron dialyzed with internal solution containing Alexa 594. z-projection of 60 images (120 μm). Note the soma and the patching electrode in the stratum (Str) pyramidale. This blurry part of the image is due to light scattering because of the high cell density in Str pyramidale. Scale bar, 30 μm. C, Quantification of microglial process outgrowth in the presence of high extracellular Mg2+ (6 mm) to block NMDAR in neurons at resting membrane potential. Significant microglia outgrowth was observed only when the neuron was depolarized to allow NMDAR activation but not when the neuron was kept hyperpolarized or when the neuron was depolarized with MK-801 added to the internal solution. One-way ANOVA with Bonferroni's multiple-comparison post-test was used for statistical comparison of the three groups. n values: 6 (−70 mV), 5 (0 mV), and 4 (MK-801). D, Demonstration of the microglial morphology shown at different time points together with part of the dendritic arbor (shown in B). z-projection of 20 images (40 μm). Note that NMDA (100 μm) does not trigger outgrowth when the neuron is kept hyperpolarized NMDA (−70 mV) compared with Pre NMDA and Post NMDA. E, Similar demonstration as shown in D but in this experiment the neuron was depolarized to remove its Mg2+ block before application of NMDA. Note the NMDA-triggered outgrowth NMDA (0 mV) compared with Pre NMDA and Post NMDA. Scale bar, 30 μm. F–H, NMDA application to brain slices from Emx-GCaMP3 mice that express the calcium indicator, GCaMP3, in neurons. F, Demonstration of NMDA-triggered Ca2+i signals in the presence of 0 or 6 mm Mg2+. Note the elevation in Ca2+i in 0 mm Mg2+ NMDA versus Pre NMDA compared within 6 mm Mg2+NMDA versus Pre NMDA. Scale bar, 50 μm. G, Graphic depiction of NMDA-triggered Ca2+i signals in the presence of 0, 0.6, and 6 mm Mg2+ measured as F/F0 in a 100 × 100 μm “region of interest” placed in the Str radiatum. F = fluorescence intensity at time x and F0 = fluorescence intensity at time 0. The traces were aligned for peak values. H, Graphic depiction of max F/F0 demonstrating that 6 mm Mg2+ significantly blocked NMDA-triggered Ca2+i signals compared with the large Ca2+i signals that were observed in 0 mm Mg2+ and 0.6 mm Mg2+ conditions. The amplitude of the neuronal Ca2+i signals evoked by NMDA in 0.6 mm Mg2+ was not reduced by TTX and CNQX. Probenecid had no effect on the NMDA-induced Ca2+i signal at the concentration (2 mm) that prevented microglia process outgrowth from NMDAR activation. One-way ANOVA with Bonferroni's multiple-comparison post-test was used for statistical comparison of the five groups, n = 3.

Similar articles

Cited by

References

    1. Ambrosi C, Gassmann O, Pranskevich JN, Boassa D, Smock A, Wang J, Dahl G, Steinem C, Sosinsky GE. Pannexin1 and Pannexin2 channels show quaternary similarities to connexons and different oligomerization numbers from each other. J Biol Chem. 2010;285:24420–24431. doi: 10.1074/jbc.M110.115444. - DOI - PMC - PubMed
    1. Baraldi PG, del Carmen Nuñez M, Morelli A, Falzoni S, Di Virgilio F, Romagnoli R. Synthesis and biological activity of N-arylpiperazine-modified analogues of KN-62, a potent antagonist of the purinergic P2X7 receptor. J Med Chem. 2003;46:1318–1329. doi: 10.1021/jm021049d. - DOI - PubMed
    1. Bargiotas P, Krenz A, Hormuzdi SG, Ridder DA, Herb A, Barakat W, Penuela S, von Engelhardt J, Monyer H, Schwaninger M. Pannexins in ischemia-induced neurodegeneration. Proc Natl Acad Sci U S A. 2011;108:20772–20777. doi: 10.1073/pnas.1018262108. - DOI - PMC - PubMed
    1. Baroja-Mazo A, Barberà-Cremades M, Pelegrín P. The participation of plasma membrane hemichannels to purinergic signaling. Biochim Biophys Acta. 2013;1828:79–93. doi: 10.1016/j.bbamem.2012.01.002. - DOI - PubMed
    1. Bialas AR, Stevens B. TGF-beta signaling regulates neuronal C1q expression and developmental synaptic refinement. Nat Neurosci. 2013;16:1773–1782. doi: 10.1038/nn.3560. - DOI - PMC - PubMed

Publication types

MeSH terms

LinkOut - more resources