. 2014 Aug 6;34(32):10780-92.
doi: 10.1523/JNEUROSCI.0723-14.2014.

Low-intensity repetitive transcranial magnetic stimulation improves abnormal visual cortical circuit topography and upregulates BDNF in mice

Affiliations

Low-intensity repetitive transcranial magnetic stimulation improves abnormal visual cortical circuit topography and upregulates BDNF in mice

Kalina Makowiecki et al. J Neurosci. .

Abstract

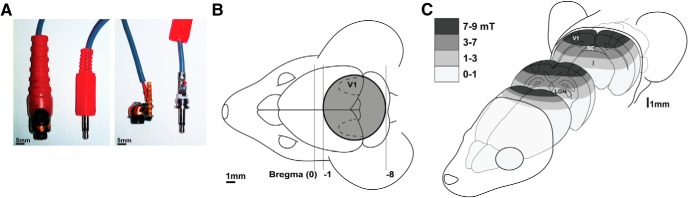
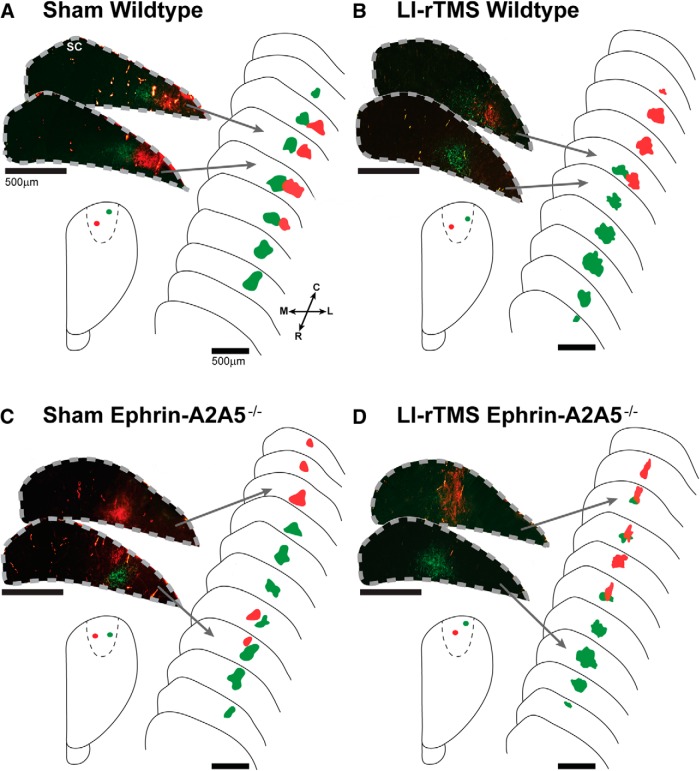
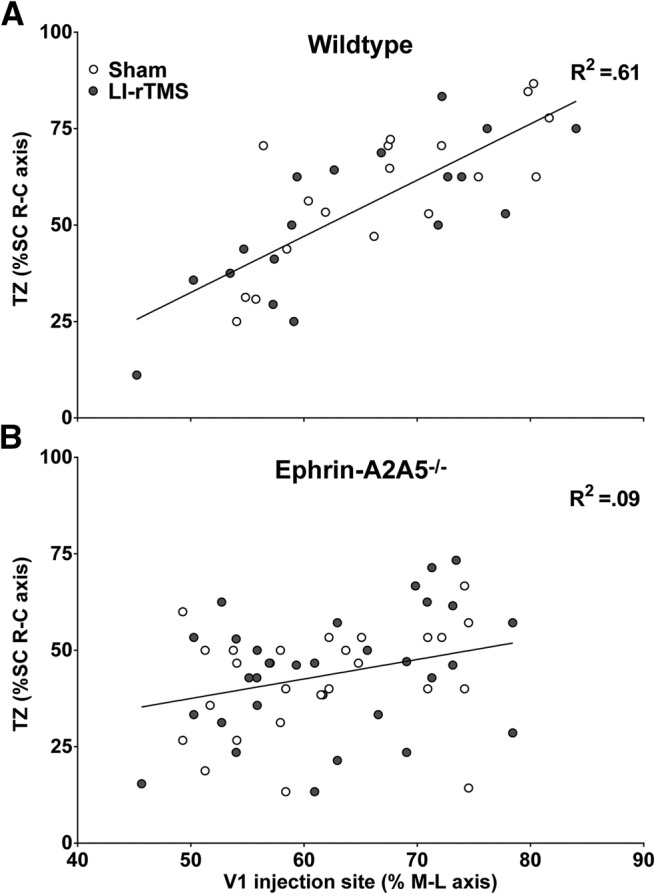
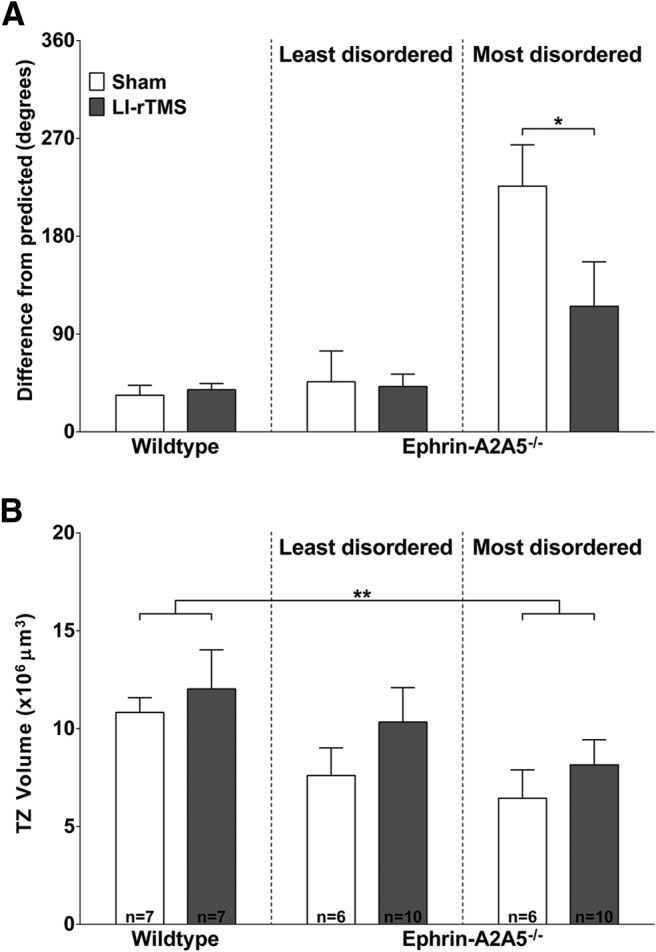
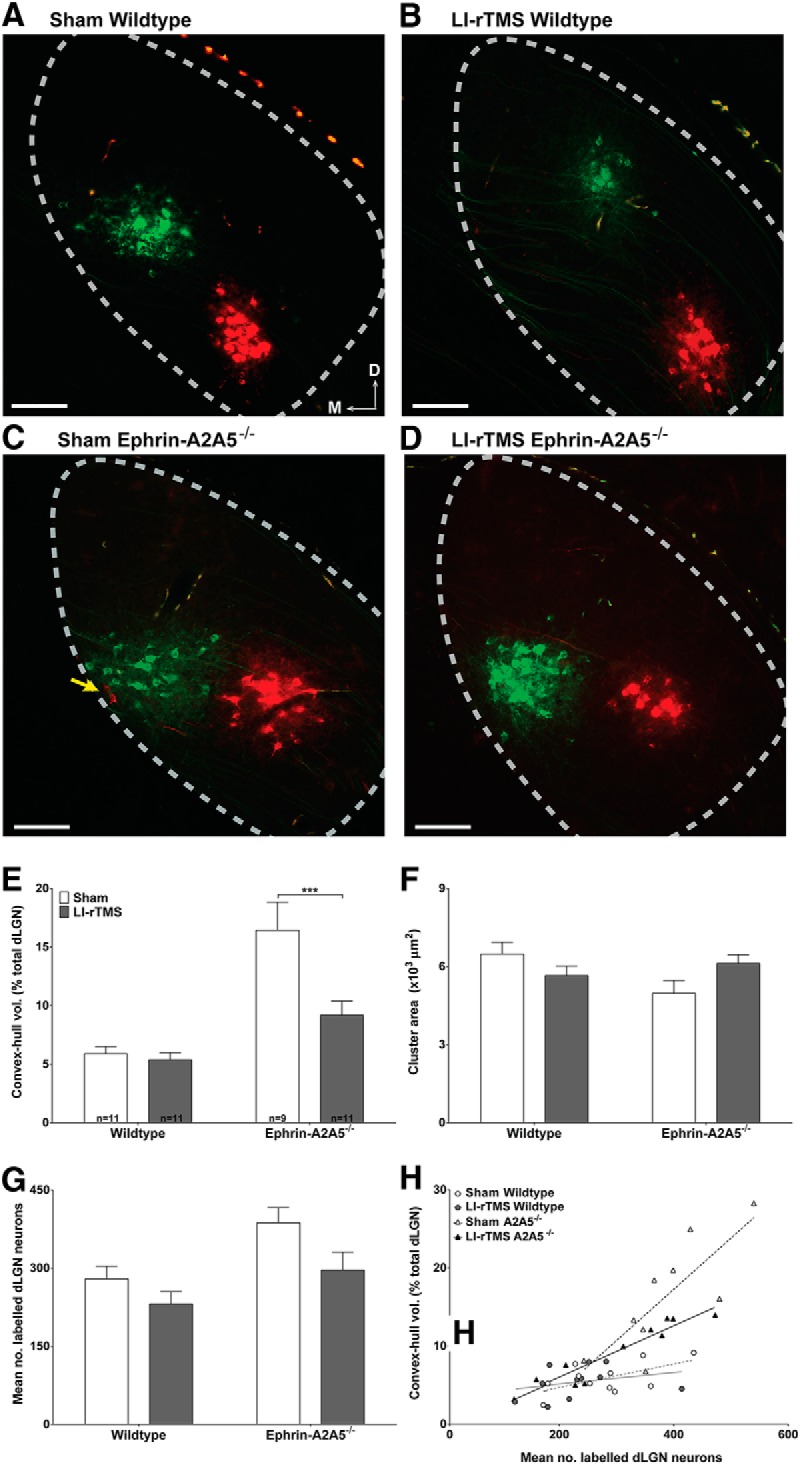
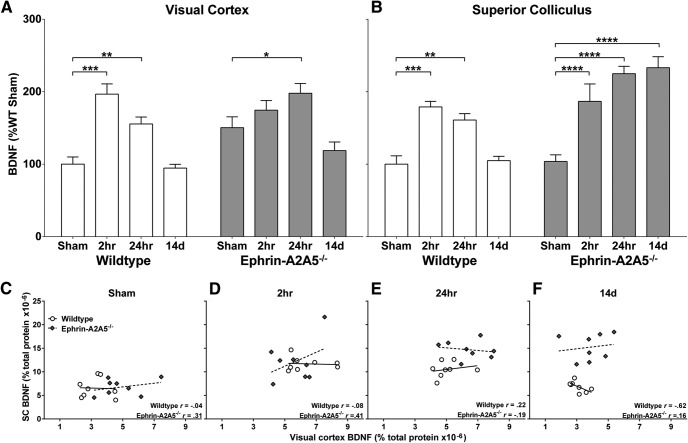
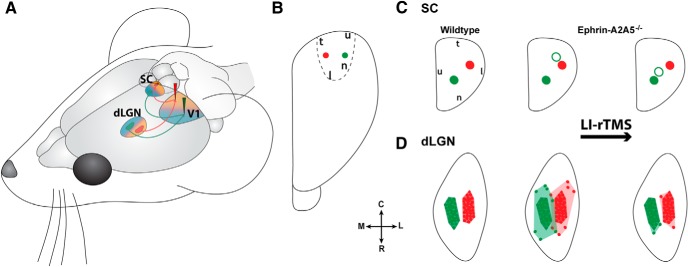
Repetitive transcranial magnetic stimulation (rTMS) is increasingly used as a treatment for neurological and psychiatric disorders. Although the induced field is focused on a target region during rTMS, adjacent areas also receive stimulation at a lower intensity and the contribution of this perifocal stimulation to network-wide effects is poorly defined. Here, we examined low-intensity rTMS (LI-rTMS)-induced changes on a model neural network using the visual systems of normal (C57Bl/6J wild-type, n = 22) and ephrin-A2A5(-/-) (n = 22) mice, the latter possessing visuotopic anomalies. Mice were treated with LI-rTMS or sham (handling control) daily for 14 d, then fluorojade and fluororuby were injected into visual cortex. The distribution of dorsal LGN (dLGN) neurons and corticotectal terminal zones (TZs) was mapped and disorder defined by comparing their actual location with that predicted by injection sites. In the afferent geniculocortical projection, LI-rTMS decreased the abnormally high dispersion of retrogradely labeled neurons in the dLGN of ephrin-A2A5(-/-) mice, indicating geniculocortical map refinement. In the corticotectal efferents, LI-rTMS improved topography of the most abnormal TZs in ephrin-A2A5(-/-) mice without altering topographically normal TZs. To investigate a possible molecular mechanism for LI-rTMS-induced structural plasticity, we measured brain derived neurotrophic factor (BDNF) in the visual cortex and superior colliculus after single and multiple stimulations. BDNF was upregulated after a single stimulation for all groups, but only sustained in the superior colliculus of ephrin-A2A5(-/-) mice. Our results show that LI-rTMS upregulates BDNF, promoting a plastic environment conducive to beneficial reorganization of abnormal cortical circuits, information that has important implications for clinical rTMS.

Keywords: LI-rTMS; corticotectal projection; critical period; ephrin-A2A5−/− mice; geniculocortical; plasticity.


Figures

Figure 1.
Figure 1.
Method of LI-rTMS delivery in mice. A, Custom-built stimulation coil and 3.5 mm jack used to connect to the pulse generator, modified for its attachment. Coil and jack are shown with (left) and without (right) protective plastic coating. B, Diagram of the stimulation coil in relation to the mouse's head, showing stereotaxic coordinates. The coil was held close to the mouse's head along the midline above the visual cortices, ensuring bilateral stimulation. C, Schematic diagram of estimated (Hall device) magnetic field intensity (in milli-teslas) in the mouse head showing approximate range of field intensities received by brain regions at different depths. The magnetic field is focal to posterior brain regions and thus more focal than the broad stimulation resulting from the use of human coils in mice (Salvador and Miranda, 2009). However, stimulation remains less focal than that induced by butterfly-shaped coils when used in human rTMS studies (Deng et al., 2013).
Figure 2.
Figure 2.
Representative photomicrographs of labeled TZs in the superior colliculus, schematic reconstructions of TZ distribution, and cortical injection sites. Section outlines are separated by 80 μm. All wild-types, regardless of receiving sham (A) or LI-rTMS (B), displayed a single TZ per injection, with lateral V1 injections (green) labeling a TZ in rostral superior colliculus and medial V1 injections (red) labeling a single TZ located more caudally in the superior colliculus. In contrast, a single cortical injection labeled two TZs in the majority of ephrin-A2A5−/− mice, although the number of additional TZs was not significantly different between mice receiving sham (C) or 14 daily sessions of LI-rTMS (D) (Fisher's exact test, p = 0.99). Note that, in C, the medial V1 injection (red) labeled two TZs, separated by 360 μm, whereas the lateral (green) labeled only a single, more rostrally located TZ. In D, the lateral (green) injection labeled two TZs, separated by 120 μm, and the medial (red) labeled only a single TZ. Photomicrographs were digitally recolored from grayscale images and separate channels merged. R, Rostral; C, caudal; M, medial; L, lateral.
Figure 3.
Figure 3.
Corticotectal TZ locations as a percentage of the superior colliculus rostral-caudal (R-C) axis are plotted as a function of V1 injection site location, as a percentage of the cortical hemisphere medial-lateral (M-L) axis. In wild-types (A), V1 injection location (percentage M-L) strongly and significantly predicted corticotectal TZ location (R-C axis). For ephrin-A2A5−/− mice (B), analyzing all TZs and successful injections together, V1 injection (percentage M-L) did not significantly predict TZ locations in the superior colliculus (SC) R-C axis and the relationship was weak. There was no significant difference between LI-rTMS and sham for either genotype. Lines represent linear best-fit regression.
Figure 4.
Figure 4.
LI-rTMS reduces extent of corticotectal topographical disorder in ephrin-A2A5−/− mice. A, Mean difference between TZ locations from that predicted by injection sites, with wild-types and the least disordered and most disordered TZ pairs within ephrin-A2A5−/− mice shown separately. LI-rTMS significantly reduced the disorder of the most disordered TZs. B, Mean volume of TZs in wild-type and ephrin-A2A5−/− mice, with wild-types and the least disordered and most disordered TZ pairs within ephrin-A2A5−/− mice shown separately. TZ volume was not significantly different between ephrin-A2A5−/− and wild-type mice for the least disordered TZs. However, the most disordered TZs were significantly smaller compared with wild-types. There was no significant effect of LI-rTMS on TZ volume. *p < 0.05.
Figure 5.
Figure 5.
LI-rTMS effects on retrograde labeling of the geniculocortical projection. A–D, Photomicrographs of retrogradely labeled neurons in the dLGN from a representative mouse of each genotype and stimulation condition. Cortical injections labeled a main cluster for all groups, suggesting largely normal geniculocortical topography. Note that wild-types in sham (A) and after 14 daily sessions of complex-waveform LI-rTMS (B) show similarly few neurons labeled outside the main cluster and similar cluster size, whereas the sham-treated ephrin-A2A5−/− mouse (C) shows labeled cells scattered across a larger area compared with the LI-rTMS-treated ephrin-A2A5−/− mouse (D) or wild-types (A, B). The yellow arrow indicates two red cells separated from the main red cluster, illustrating broad scatter of labeled neurons in the sham-treated ephrin-A2A5−/− mouse. Photomicrographs were digitally recolored from grayscale images and separate channels merged. Scale bars, 100 μm. E, Quantification of retro gradely labeled cell dispersion in the dLGN. The mean percentage of the total dLGN volume occupied by the convex-hull (in cubic micrometers), defined by the volume of straight lines joining the outermost labeled cells, was greatest in sham-treated ephrin-A2A5−/− mice and decreased with LI-rTMS; in wild-types, dispersion was similar between sham and LI-rTMS. F, Mean labeled neuron cluster area (in square micrometers) in the dLGN was similar between all groups. G, Mean number of labeled dLGN neurons. LI-rTMS decreased the number of labeled cells in both genotypes, although the magnitude of this decrease was greater in ephrin-A2A5−/− mice than in wild-types. Error bars indicate SEM. H, Cell dispersion (convex-hull volume as percentage total dLGN volume) as a function of total number of labeled dLGN neurons. Note that although sham-treated ephrin-A2A5−/− mice had somewhat more labeled neurons compared with other groups, at any given number of labeled neurons, dispersion tended to be greater in sham-treated ephrin-A2A5−/− mice than other groups. Lines represent linear best-fit regression. A2A5−/−, Ephrin-A2A5−/− mice; D, dorsal; M, medial. ***p < 0.001.
Figure 6.
Figure 6.
BDNF concentrations in ephrin-A2A5−/− and wild-type mice, contrasting control, single, and multiple LI-rTMS session groups. BDNF concentration, normalized to percentage of wild-type sham, in visual cortex (A) and superior colliculus (B) 2 and 24 h after a single LI-rTMS session and after 14 d of daily LI-rTMS (24 h after final stimulation) are compared with sham (no stimulation control). C–F, Scatterplots of BDNF concentration (as percentage of total protein) between visual cortex and superior colliculus shown separately for each genotype and stimulation time point. All correlations were nonsignificant. Lines represent linear best-fit. *p < 0.05; **p < 0.01; ***p < 0.001; ****p < 0.0001.
Figure 7.
Figure 7.
Summary of topographical reorganization effects of LI-rTMS. A, Schematic diagram illustrating appropriate topographic projections of the corticotectal (efferent) and geniculocortical (afferent) projections from medial (red) and lateral (green) locations in V1. Shading represents nasal (blue) and temporal (orange) visual field maps for each region. Arrows indicate direction of visual information flow. B, Dorsal view of the visual cortex showing injection sites. C, D, Dorsal view of characteristic labeling in superior colliculus (C) and dLGN (D) resulting from injections shown in B for wild-type and ephrin-A2A5−/− mice. After LI-rTMS (far right), ephrin-A2A5−/− mice showed a shift of ectopic terminal zones (open circles) toward a more topographically appropriate location in the superior colliculus, whereas the appropriate TZs (filled circles) were unaffected (C). In the dLGN, ephrin-A2A5−/− mice showed decreased labeled cell dispersion (D)—that is, a smaller convex hull volume (pale shading)—whereas the main labeled cell cluster (dark-shaded area) size remained the same. SC, Superior colliculus; R, rostral; C, caudal; M, medial; L, lateral; for the following, orientation refers to visual field: n, nasal; t, temporal; u, upper; l, lower.

Similar articles

Cited by

References

    1. Afifi L, Jarrett Rushmore R, Valero-Cabré A. Benefit of multiple sessions of perilesional repetitive transcranial magnetic stimulation for an effective rehabilitation of visuospatial function. Eur J Neurosci. 2013;37:441–454. doi: 10.1111/ejn.12055. - DOI - PMC - PubMed
    1. Alle H, Geiger JR. Combined analog and action potential coding in hippocampal mossy fibers. Science. 2006;311:1290–1293. doi: 10.1126/science.1119055. - DOI - PubMed
    1. Arias-Carrión O, Verdugo-Díaz L, Feria-Velasco A, Millán-Aldaco D, Gutiérrez AA, Hernández-Cruz A, Drucker-Colín R. Neurogenesis in the subventricular zone following transcranial magnetic field stimulation and nigrostriatal lesions. J Neurosci Res. 2004;78:16–28. doi: 10.1002/jnr.20235. - DOI - PubMed
    1. Arnsten AF, Rubia K. Neurobiological circuits regulating attention, cognitive control, motivation, and emotion: disruptions in neurodevelopmental psychiatric disorders. J Am Acad Child Adolesc Psychiatry. 2012;51:356–367. doi: 10.1016/j.jaac.2012.01.008. - DOI - PubMed
    1. Autry AE, Monteggia LM. Brain-derived neurotrophic factor and neuropsychiatric disorders. Pharmacol Rev. 2012;64:238–258. doi: 10.1124/pr.111.005108. - DOI - PMC - PubMed

Publication types

MeSH terms

LinkOut - more resources