. 2014 Sep 26;289(39):26859-26871.
doi: 10.1074/jbc.M114.595066. Epub 2014 Aug 6.

Distinguishing closely related amyloid precursors using an RNA aptamer

Affiliations

Distinguishing closely related amyloid precursors using an RNA aptamer

Claire J Sarell et al. J Biol Chem. .

Abstract

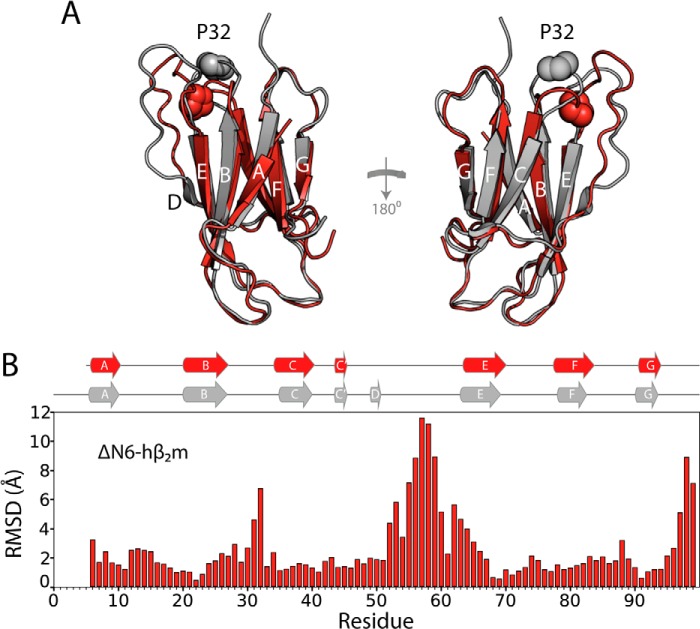
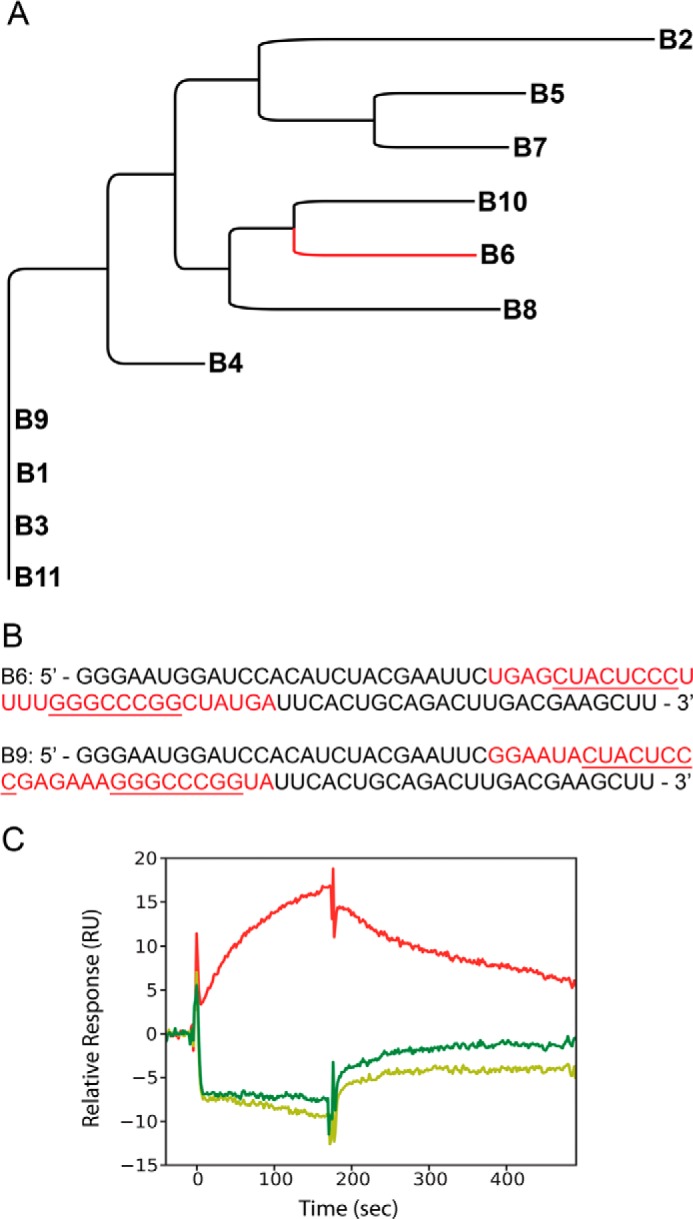
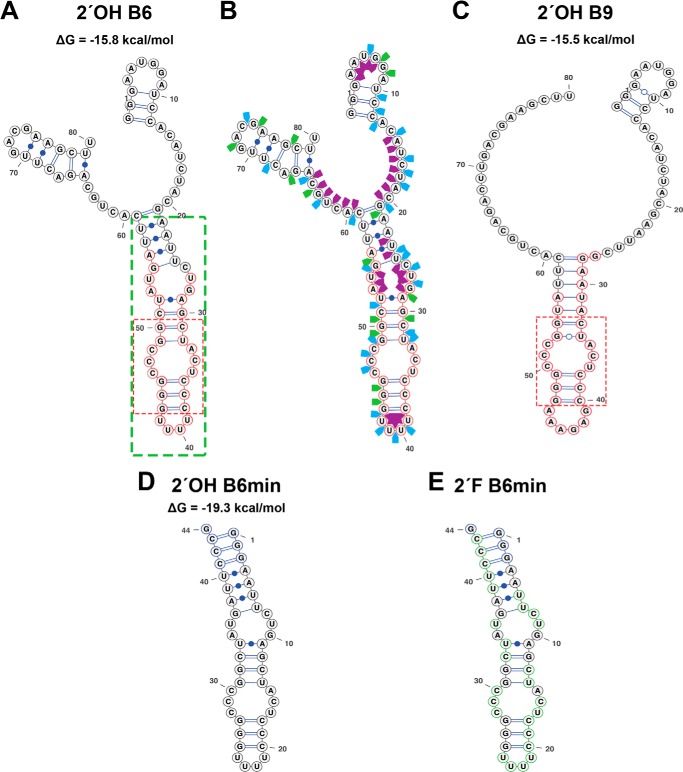
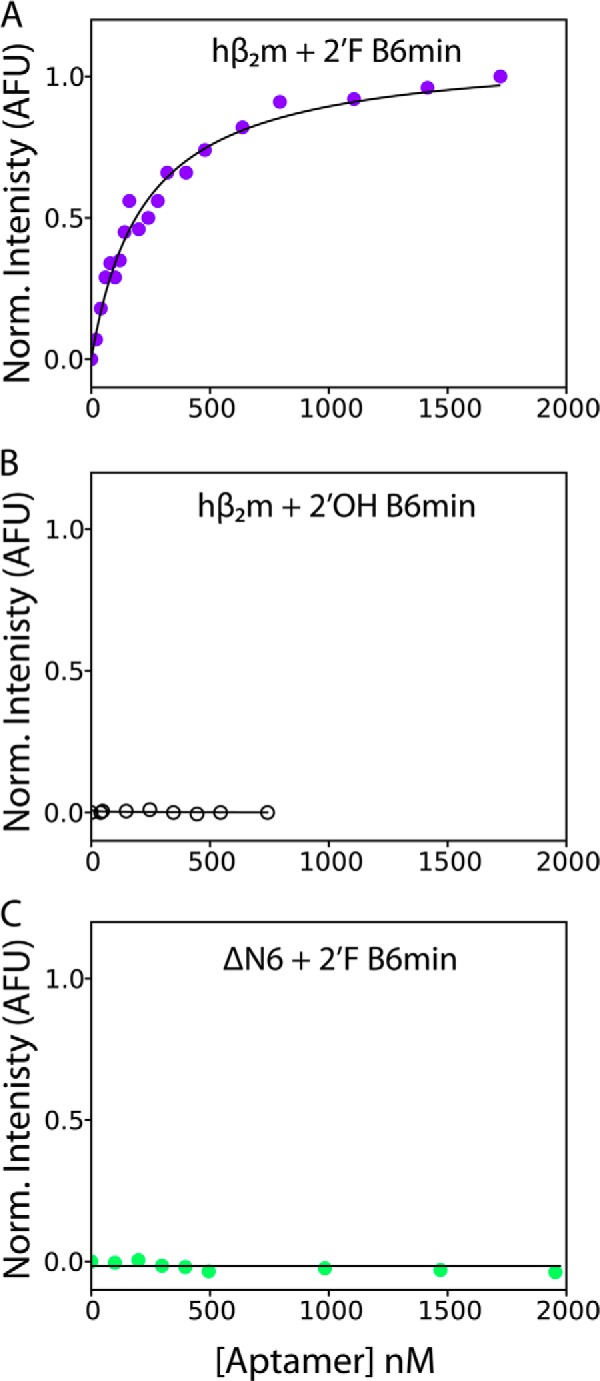
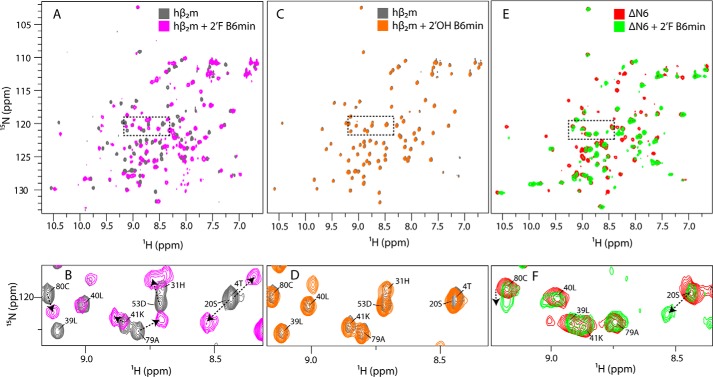
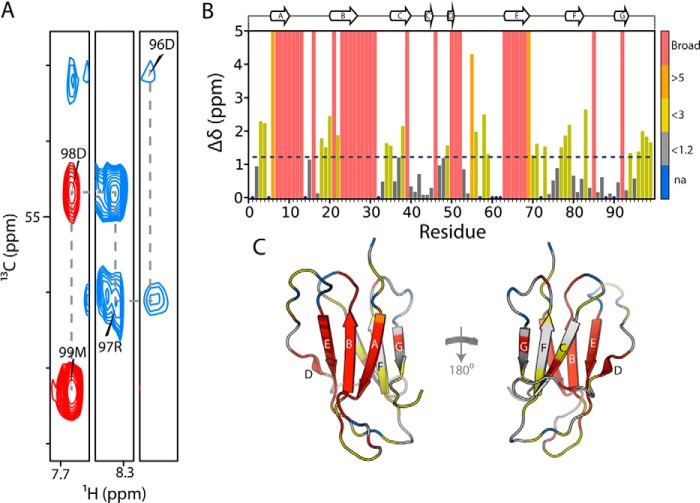
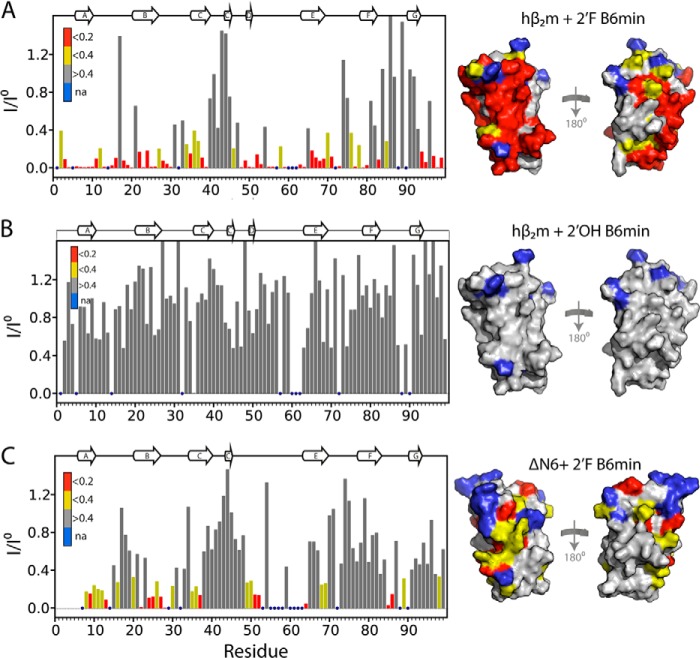
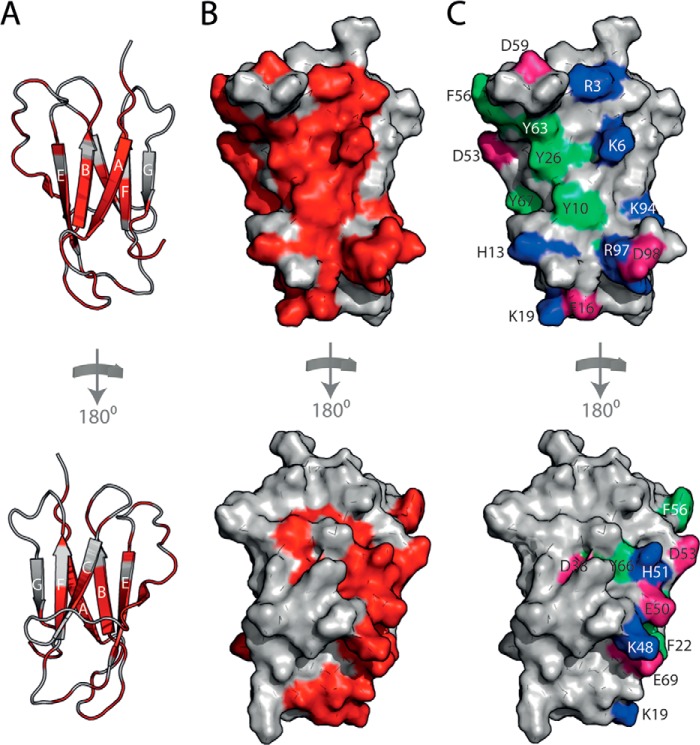
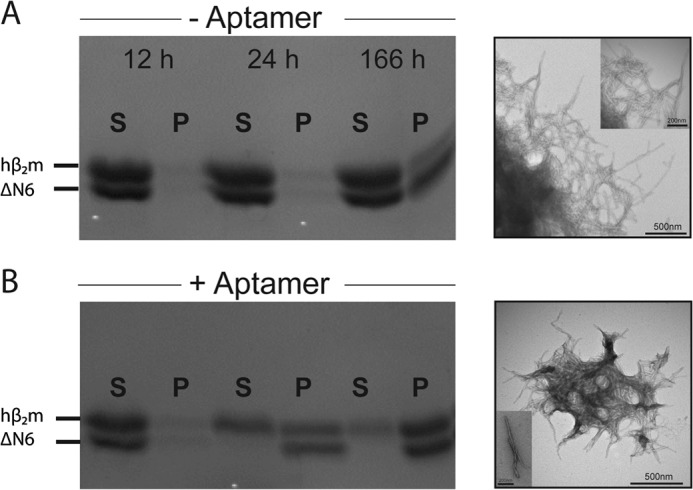
Although amyloid fibrils assembled in vitro commonly involve a single protein, fibrils formed in vivo can contain multiple protein sequences. The amyloidogenic protein human β2-microglobulin (hβ2m) can co-polymerize with its N-terminally truncated variant (ΔN6) in vitro to form hetero-polymeric fibrils that differ from their homo-polymeric counterparts. Discrimination between the different assembly precursors, for example by binding of a biomolecule to one species in a mixture of conformers, offers an opportunity to alter the course of co-assembly and the properties of the fibrils formed. Here, using hβ2m and its amyloidogenic counterpart, ΔΝ6, we describe selection of a 2'F-modified RNA aptamer able to distinguish between these very similar proteins. SELEX with a N30 RNA pool yielded an aptamer (B6) that binds hβ2m with an EC50 of ∼200 nM. NMR spectroscopy was used to assign the (1)H-(15)N HSQC spectrum of the B6-hβ2m complex, revealing that the aptamer binds to the face of hβ2m containing the A, B, E, and D β-strands. In contrast, binding of B6 to ΔN6 is weak and less specific. Kinetic analysis of the effect of B6 on co-polymerization of hβ2m and ΔN6 revealed that the aptamer alters the kinetics of co-polymerization of the two proteins. The results reveal the potential of RNA aptamers as tools for elucidating the mechanisms of co-assembly in amyloid formation and as reagents able to discriminate between very similar protein conformers with different amyloid propensity.

Keywords: Amyloid; Amyloid Fibril; Amyloid Precursor; Aptamer; Co-polymerization; Protein Aggregation; Protein Folding; RNA Aptamer; Structural Biology; β2-Microglobulin.


Figures

FIGURE 1.
FIGURE 1.
Comparison of the structures of hβ2m and ΔΝ6. A, the structure of hβ2m (gray ribbon, Protein Data bank code 2XKS (19)) and ΔN6 (red schematic, Protein Data Bank code 2XKU (19)). The two β-sheets of the proteins comprising the A, B, E, and D β-strands and the C, F, and G β-strands are shown. Pro-32 is shown in space fill. B, per residue r.m.s.d. chart for the backbone atoms of hβ2m and ΔΝ6 (overall backbone r.m.s.d. ∼ 1.5Å). The positions of the β-strands in these proteins are shown on top as gray (hβ2m) and red (ΔΝ6) ribbons.
FIGURE 2.
FIGURE 2.
Aptamer selection. A, the relationship of B6 to the 10 other sequences from the SELEX pool. B, sequences of aptamers B6 and B9. The selected regions are shown in red, and their common sequence motifs are underlined. C, surface plasmon resonance traces generated upon incubation of 1 μm 2′F B6 (50 mm MES buffer, 120 mm NaCl, pH 6.2) over flow cells immobilized with hβ2m (red), ΔN6 (dark green), or murine β2m (light green). RU, response units.
FIGURE 3.
FIGURE 3.
Secondary structures of the B6 and B9 aptamers. A, the Mfold secondary structure prediction of the full-length B6 aptamer with the nucleotides within the green box showing the region truncated to create the B6min aptamer sequence. Nucleotides circled in red define the random region. B, enzymatic solution structure probing of the full-length B6 transcript with the random region highlighted in red. Cleavage sites by the G-specific RNase T1 (green arrows), U and C-specific RNase A (blue arrows), and single-stranded RNA specific S1 nuclease (purple arrows) are shown. C, the Mfold of the full-length B9 aptamer with the selected region highlighted as described in A. The dotted red boxes in A and C showed the conserved sequences and secondary structure elements of both aptamers. D, secondary structure of 2′ OH B6min. E, 2′F B6min stem loops. These have additional 5′-GGG and 3′-CCCG sequences added to increase their folded stability. 2′F pyrimidines are circled in green in E.
FIGURE 4.
FIGURE 4.
Binding of 2′OH B6min and 2′F B6min to hβ2m and ΔN6 measured using intrinsic tryptophan fluorescence. A, normalized tryptophan fluorescence of hβ2m (1 μm) upon addition of 2′F B6min (0–1.7 μm). The data are fitted to a logistic equation (solid line). The data are normalized (Norm.) between 0 (no aptamer) and 1 (the fluorescence signal in the presence of 1.7 μm aptamer) (see “Experimental Procedures”). B, titration of hβ2m (1 μm) with 2′OH B6min. C, titration of ΔN6 (1 μm) with 2′F B6min. No fluorescence change was observed over the concentrations of aptamer added in B and C. These data were normalized between 0 (no aptamer) and 1 (the fluorescence signal when 1.7 μΜ of 2′F B6min was added to hβ2m. All experiments were performed in 50 mm MES buffer, 120 mm NaCl, pH 6.2. AFU, arbitrary fluoresence units.
FIGURE 5.
FIGURE 5.
Chemical shift changes upon the addition of aptamers to hβ2m and ΔN6. A, the 1H-15N HSQC spectrum of 15N,13C-labeled hβ2m (60 μm) alone (gray) or in the presence of two molar equivalents of 2′F B6min (magenta). B, expansion of the region boxed in A. C, the 1H-15N HSQC spectrum of 15N,13C-labeled hβ2m (60 μm) alone (gray) or in the presence of two molar equivalents of 2′OH B6min (orange). D, expansion of the region boxed in C. E, the 1H-15N HSQC spectrum of 15N,13C-labeled ΔN6 (60 μm) alone (red) or in the presence of two molar equivalents of 2′F B6min (green). F, expansion of the region boxed in E. Chemical shift changes in B, D, and F are annotated with arrows. All spectra were obtained at 25 °C, pH 6.2.
FIGURE 6.
FIGURE 6.
Chemical shift changes upon binding of 2′F B6min to hβ2m. A, zoomed in regions of the two-dimensional HNCA spectrum of 13C,15N-hβ2m with 2 molar equivalents of 2′F B6min. The assignment walk on the Cα values is shown for the four residues. B, chemical shift changes of hβ2m upon interaction with 2′F B6min. Total chemical shift change was calculated as √((5 × Δδ 1H)2 + (Δδ 15N)2). Residues for which assignments were not possible as a consequence of exchange broadening or large chemical shift perturbation are given an arbitrary value of 5 ppm and are shown in red. The dashed line represents two S.D. over the entire data set. C, the structure of hβ2m colored according to the measured chemical shift changes shown in B.
FIGURE 7.
FIGURE 7.
2′F B6 distinguishes between two highly similar proteins. A, plot of the loss of signal intensity of resonances in native hβ2m upon binding to a 2-fold molar excess of 2′F B6min using data shown in Fig. 5A. Profiles were calculated as the ratio of the peak intensity in the presence (I) or absence (Io) of a 2-fold molar excess of aptamer. Intensity profiles were normalized to residues 40–45 that are not involved in the interface. Residues with a ratio of <0.2 are colored red, those showing a ratio between 0.2 and 0.4 are colored yellow, and those with no significant decrease in intensity are colored gray. The structure of hβ2m drawn as a surface representation is shown on the right color-coded using the same scale. Residues with no assignments (na) are shown in blue. B, as described in A, but for the interaction of 2′OH B6min and hβ2m. C, as described in A, but for the interaction of 2′F Β6min with ΔΝ6. The secondary structure elements of the proteins are shown as ribbons on top of the panels.
FIGURE 8.
FIGURE 8.
Mapping the 2′F B6min-hβ2m binding site. A, the residues in hβ2m that show the largest decrease in intensity upon interaction with 2′F B6min are shown in red on the structure of hβ2m (gray schematic) and predominantly involve residues in the A, B, E, and D β-strands of hβ2m. By contrast, the C, F, and G β-strands show relatively little change in intensity (bottom). B, surface representation of hβ2m highlighting the interface residues (red). C, the 2′F B6min-hβ2m binding interface involves seven aromatic residues (light green), seven positively charged residues (blue), and seven negatively charged residues (pink).
FIGURE 9.
FIGURE 9.
2′F B6min affects hβ2m-ΔN6 co-polymerization into fibrils. A, the course of aggregation of mixtures of hβ2m and ΔN6 (each 40 μm) in the absence of a 2-molar excess of aptamer determined by SDS-PAGE. The morphology of the aggregates formed after 166 h is shown by TEM. B, as described for A but in the presence of a 2-fold molar excess of 2′F B6min. S, supernatant; P, pellet. Incubation was performed in 50 mm MES, 120 mm NaCl, pH 6.2, with 600 rpm agitation at 37 °C. The scale bars on the TEM images represent 500 nm. For the inset, scale bars in the TEM images are 200 nm.
FIGURE 10.
FIGURE 10.
Structural differences between hβ2m and ΔΝ6 in the aptamer binding surface. A, the aromatic residues located in the interface between 2′F B6min and hβ2m (see Fig. 8) are highlighted as sticks on hβ2m (black ribbon) and ΔΝ6 (red ribbon). Close ups of four residues are shown alongside. B, the structure of hβ2m (left) and ΔΝ6 (right) shown as a surface representation colored by its electrostatic potential (blue, positive; red, negative). The N-terminal region is highlighted in a circle, and the DE loop region is annotated with a black arc.

Similar articles

Cited by

References

    1. Eisenberg D., Jucker M. (2012) The amyloid state of proteins in human diseases. Cell 148, 1188–1203 - PMC - PubMed
    1. Berthelot K., Cullin C., Lecomte S. (2013) What does make an amyloid toxic: morphology, structure or interaction with membrane? Biochimie 95, 12–19 - PubMed
    1. Chiti F., Dobson C. M. (2009) Amyloid formation by globular proteins under native conditions. Nat. Chem. Biol. 5, 15–22 - PubMed
    1. Sarell C. J., Woods L. A., Su Y., Debelouchina G. T., Ashcroft A. E., Griffin R. G., Stockley P. G., Radford S. E. (2013) Expanding the repertoire of amyloid polymorphs by co-polymerization of related protein precursors. J. Biol. Chem. 288, 7327–7337 - PMC - PubMed
    1. Lee C. F., Bird S., Shaw M., Jean L., Vaux D. J. (2012) Combined effects of agitation, macromolecular crowding, and interfaces on amyloidogenesis. J. Biol. Chem. 287, 38006–38019 - PMC - PubMed

Publication types

MeSH terms