. 2014 Jul 23:8:168.
doi: 10.3389/fncel.2014.00168. eCollection 2014.

Dendritic diameters affect the spatial variability of intracellular calcium dynamics in computer models

Affiliations

Dendritic diameters affect the spatial variability of intracellular calcium dynamics in computer models

Haroon Anwar et al. Front Cell Neurosci. .

Abstract

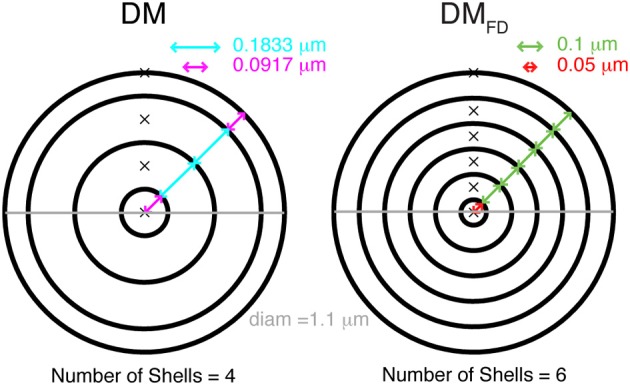
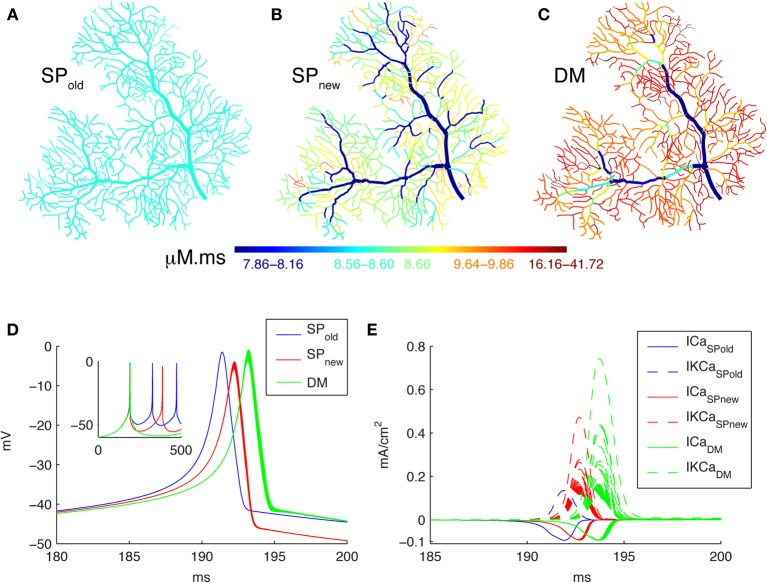
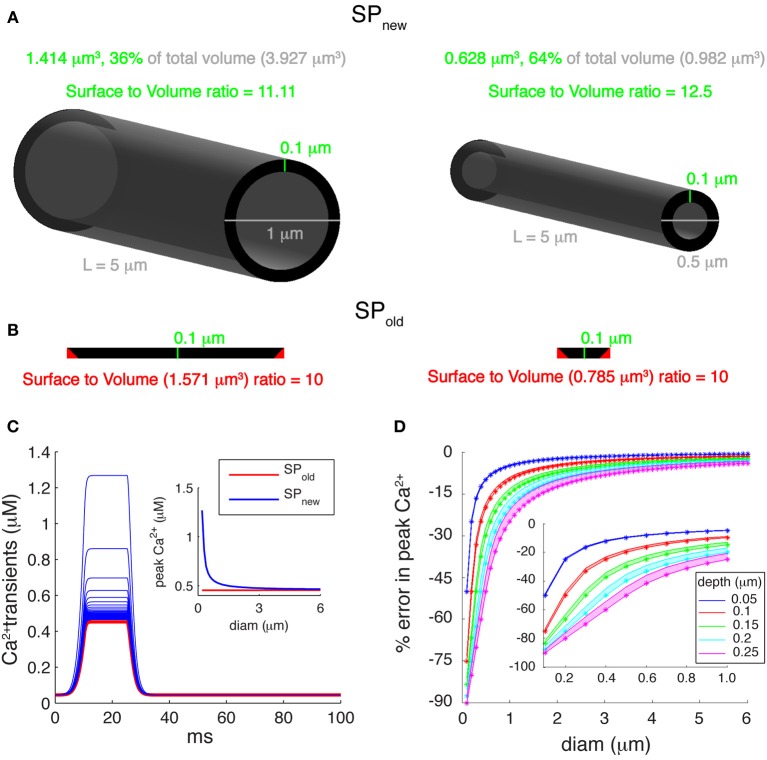
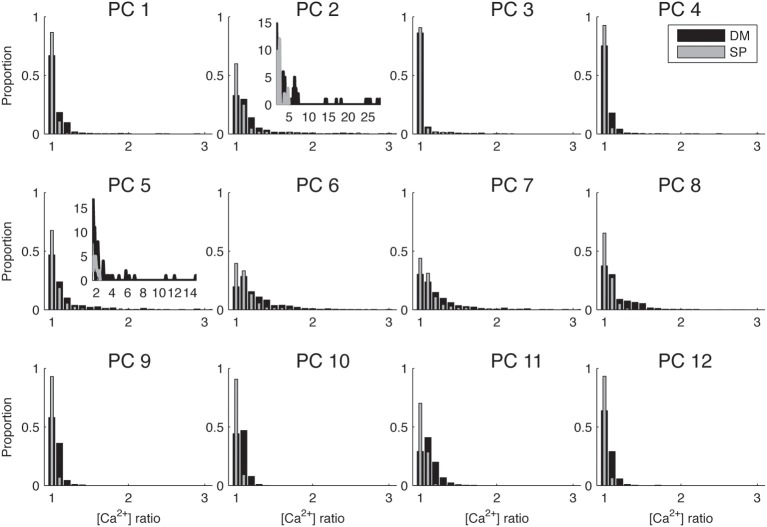
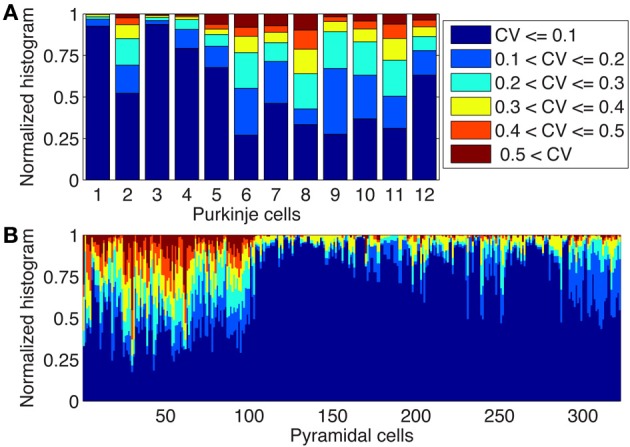
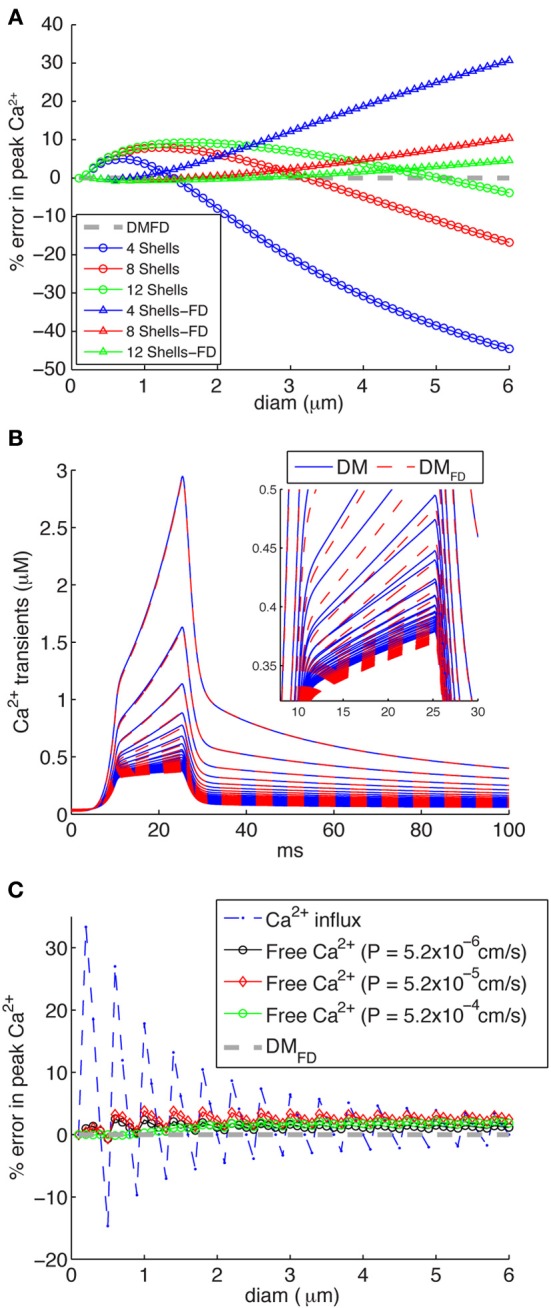
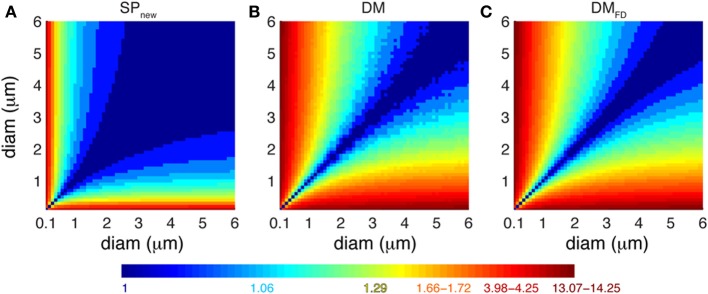
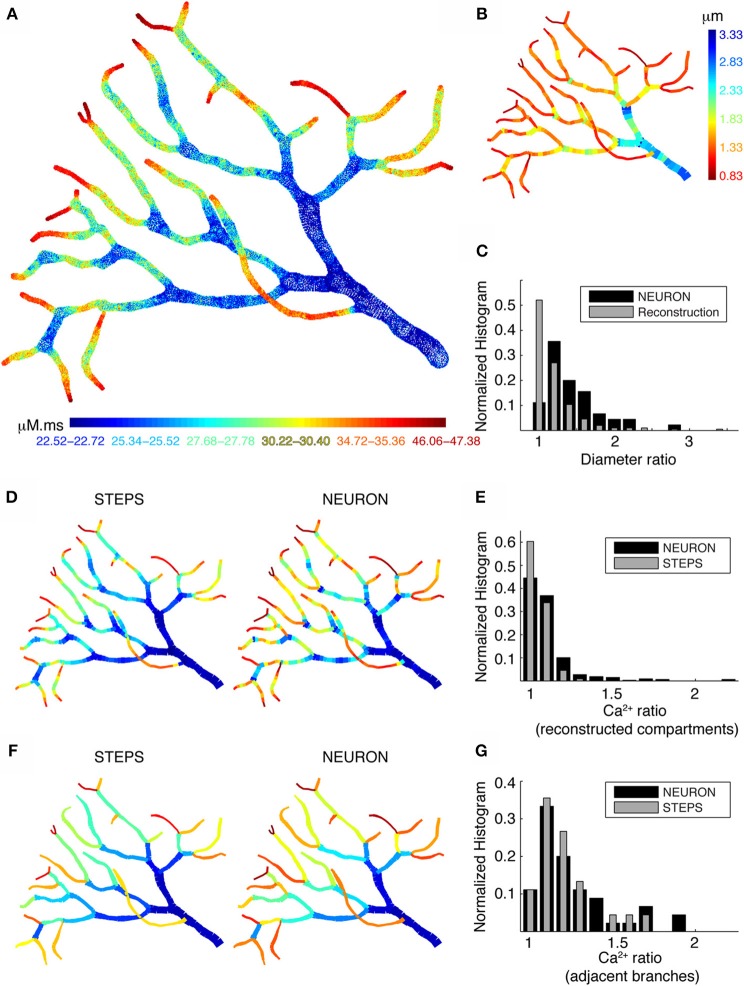
There is growing interest in understanding calcium dynamics in dendrites, both experimentally and computationally. Many processes influence these dynamics, but in dendrites there is a strong contribution of morphology because the peak calcium levels are strongly determined by the surface to volume ratio (SVR) of each branch, which is inversely related to branch diameter. In this study we explore the predicted variance of dendritic calcium concentrations due to local changes in dendrite diameter and how this is affected by the modeling approach used. We investigate this in a model of dendritic calcium spiking in different reconstructions of cerebellar Purkinje cells and in morphological analysis of neocortical and hippocampal pyramidal neurons. We report that many published models neglect diameter-dependent effects on calcium concentration and show how to implement this correctly in the NEURON simulator, both for phenomenological pool based models and for implementations using radial 1D diffusion. More detailed modeling requires simulation of 3D diffusion and we demonstrate that this does not dissipate the local concentration variance due to changes of dendritic diameter. In many cases 1D diffusion of models of calcium buffering give a good approximation provided an increased morphological resolution is implemented.

Keywords: active dendrite; calcium buffering; calcium concentration; compartmentalization; dendritic diameter; diffusion; intracellular calcium; morphology.


Figures

Figure 1
Figure 1
Cytosolic compartmentalization for diffusion from membrane toward the center of a cylindrical compartment. Schematic diagram shows two different ways of dividing the compartment volume into concentric shells. The DM mechanism (left) has a fixed number of shells and the depths of all shells vary so that the sum equals the compartment diameters, the outer shell also has a smaller depth than subsequent shells. In the DMFD mechanism (right) all shells have an identical, fixed depth except for the core shell whose depth is adjusted to get the correct compartment diameter. The number of shells is given by compartment diameter.
Figure 2
Figure 2
Spatial Ca2+ gradients strongly depend on type of model implementation. Panels (A–C) show maps of the integrated calcium levels in the dendrite during a spontaneous burst of Ca2+ spikes (panel D). The dendritic branches are color coded to show the integrated calcium levels using a 20 ms window around the peak Ca2+ concentration of the first dendritic Ca2+ spike. The color scales used in these maps are nonlinear (using histogram equalization) to enhance the contrast. (A) Single Ca2+ pool model using SPold mechanism results in homogenous Ca2+ levels. (B) Single Ca2+ pool model using SPnew mechanism results in variable Ca2+ levels. (C) Detailed Ca2+ dynamics model with buffering and 1D diffusion results in variable Ca2+ levels with larger Ca2+ gradients. (D) Voltage traces show the first spike of the Ca2+ burst for each model in all dendritic compartments for the 3 different models (see color code in Figure). The inset shows complete traces. (E) The underlying Ca2+ and KCa currents (recorded from all dendritic compartments) for the Ca2+ spike of the three different models (see color code in Figure).
Figure 3
Figure 3
Errors introduced by incorrect submembrane volumes of single pool models. (A) Comparison between cylindrical dendritic compartments with diameters of 1 μm (left) and 0.5 μm (right) with submembrane shells with a depth of 0.1 μm. A correct implementation of the volume of the submembrane shell representing the single Ca2+ pool (SPnew mechanism) results in a SVR that depends on the compartment diameter. (B) For the same compartments using the SPold mechanism results in volumes that are too large and have a constant SVR. The cross-sectional area of each compartment (black disks shown in A) is unfolded and drawn to show that the actual volume of the submembrane shell (SPnew) is smaller than the volume used in the SPold mechanism. The red triangles represent extra cross-sectional area included in the volume of SPold. (C) Ca2+ transients generated using a “ramp-like” voltage command in single compartments with diameters ranging from 0.2 to 6 μm in steps of 0.1 μm. P-type Ca2+ channel with Pmax of 5.2 × 10⁻⁵ cm/s was used for Ca2+ influx. Inset: comparison of peak amplitudes of Ca2+ transients using SPold and SPnew show that the first mechanism causes exactly the same transient in all compartments, whereas, SPnew causes transients with varying peak Ca2+ amplitudes. (D) Error in peak Ca2+ levels caused by using the SPold mechanism [error = (max([Ca2+]SP_old) − max([Ca2+]SP_new)/max([Ca2+]SP_new))]. Pool models used β-values of 0.02, 6.86, and 10 ms−1; and depth (d) values of 0.05, 0.1, 0.15, 0.2, and 0.25 μm. The lower edge of shaded areas of each color shows error in peak calcium for β-value of 10 ms−1, whereas, the upper edge of shaded areas of each color show error for β-value of 0.02 ms−1. The colored asterisks show corresponding error for β-value (used to model PC dendrites) of 6.86 ms−1. Inset highlights large errors for branches with small diameters (diam ≤ 1 μm).
Figure 4
Figure 4
Biophysically detailed Ca2+ dynamics model causes larger differences in calcium levels in adjacent dendritic branches than single pool models. Histograms of ratios between integrated calcium from adjacent dendritic branches for 12 different PCs using SPnew and DM. To make the differences between cells more visible only the range of ratios 1–3 is shown, for the two cells that have significantly larger ratios the full distribution is shown in the inset. PC1 is shown in Figure 2. Integrated Ca2+ was computed for 20 ms around the first peak of Ca2+ transients for all PCs.
Figure 5
Figure 5
Large changes in diameters of unbranched dendritic segments exist in Purkinje and Pyramidal neurons. Stacked histograms show the distribution of CV values for the diameters changes over unbranched dendritic segments in Purkinje cells (A, N = 12) and in neocortical and hippocampal pyramidal neurons (B, N = 322). Notice the presence of large variability of diameters (CVs > 0.2 or more) in many neurons and the large neuron to neuron differences which are mostly caused by lab to lab differences in reconstruction quality (see text).
Figure 6
Figure 6
Inaccuracies of different calcium 1D diffusion models result in erroneous calcium levels. (A) Errors introduced by making the number of concentric shells independent of compartment diameter, for 4, 8, or 12 shells respectively. Two mechanisms are implemented: the standard NEURON scheme with variable depths for all shells (circles) and an FD scheme where the submembrane shell has a constant depth d1 = 0.1 μm and the rest of the shells has variable depth (triangles). The DMFD mechanism is used as reference. Note that for both mechanisms the errors become large for diameters beyond 2 μm if only four shells are used (as is the case in some NEURON models). (B) Ca2+ transients generated using a “ramp-like” voltage command in single compartments (see Figure 3C for details) comparing the responses of the DM and DMFD models. Both models show very similar behavior with only small numerical differences. (C) Errors due to discretization of radial shells in DM, which may result in variable d1 resulting in rapid changes of submembrane shell volume for increasing compartment diameter. The broken line with asterisks shows errors related to conversion of Ca2+ influx to Ca2+ concentration with variable depth d1 of the submembrane shell (it varies between 0.075 and 0.125 μm due to discretization) as compared to fixed d1 of 0.1 μm (DMFD). The solid lines with diamonds shows the actual error in free Ca2+ in the submembrane shell for DM models for different sizes of Ca2+ influx as indicated. Note that these errors are much smaller than predicted by the Ca2+ influx conversion.
Figure 7
Figure 7
Different Ca2+ buffering model respond variably to changes in dendrite diameters. Predicted ratio of integrated Ca2+ concentration (100 ms window) for different combinations of diameters of pairs of dendritic compartments using (A) SPnew, (B) DM, and (C) DMFD. The maps are derived from the data shown in Figure 3C (A) and Figure 6B (B,C). The color scales used in these maps are nonlinear (using histogram equalization) to enhance the contrast.
Figure 8
Figure 8
Large differences in calcium levels in adjacent dendritic branches persist in presence of 3D diffusion. (A) STEPS model using 3D buffered diffusion to compute the Ca2+ concentration resulting from the burst of Ca2+ spikes. Spatial map of integrated calcium (140 ms window) in a piece of carefully reconstructed PC dendritic arbor (part of PC 1). Every colored dot drawn at the center coordinates of each tetrahedron belonging to the mesh in which 3D diffusion was simulated shows the integrated Ca2+ in that particular tetrahedron. Only tetrahedrons representing the submembrane region are plotted. The color scales used in these maps are nonlinear (using histogram equalization) to enhance the contrast. (B) Spatial map of dendritic diameters in the dendrite shown in (A,D,F). (C) Normalized histograms compare the ratios of adjacent diameters in the original morphological reconstruction with similar ratios of diameters of adjacent compartments in the NEURON model (1 segment per unbranched section). (D,E) NEURON simulation with many compartments for each unbranched segment, carefully reflecting the variability of dendrite diameter. Data for the STEPS simulation are averaged over all tetrahedrons representing the corresponding NEURON compartment. (F,G) NEURON simulation with a single compartment for each unbranched segment, data for the STEPS simulation averaged for corresponding NEURON compartments. (D,F) Spatial maps of integrated submembrane Ca2+ concentration using the detailed calcium dynamics model with 3D diffusion (STEPS) and 1D radial diffusion (NEURON) are shown for the different compartmentalization schemes. (D) and (F) Use same color as in A. (E,G) Normalized histograms show the ratios of integrated Ca2+ concentration between every adjacent compartment using simulations with 3D diffusion (STEPS) and 1D diffusion (NEURON) for the results shown in (D,F) respectively.

References

    1. Antunes G., De Schutter E. (2012). A stochastic signaling network mediates the probabilistic induction of cerebellar long-term depression. J. Neurosci. 32, 9288–9300 10.1523/JNEUROSCI.5976-11.2012 - DOI - PMC - PubMed
    1. Anwar H., Hepburn I., Nedelescu H., Chen W., De Schutter E. (2013). Stochastic calcium mechanisms cause dendritic calcium spike variability. J. Neurosci. 33, 15848–15867 10.1523/JNEUROSCI.1722-13.2013 - DOI - PMC - PubMed
    1. Anwar H., Hong S., De Schutter E. (2012). Controlling Ca2+-activated K+ channels with models of Ca2+ buffering in purkinje Cells. Cerebellum 11, 681–693 10.1007/s12311-010-0224-3 - DOI - PMC - PubMed
    1. Augustine G. J., Santamaria F., Tanaka K. (2003). Local calcium signaling in neurons. Neuron 40, 331–346 10.1016/S0896-6273(03)00639-1 - DOI - PubMed
    1. Berridge M. (1998). Neuronal calcium signaling review. Neuron 21, 13–26 10.1016/S0896-6273(00)80510-3 - DOI - PubMed

LinkOut - more resources