. 2014 Jul 18:8:70.
doi: 10.3389/fnana.2014.00070. eCollection 2014.

Subcollicular projections to the auditory thalamus and collateral projections to the inferior colliculus

Affiliations

Subcollicular projections to the auditory thalamus and collateral projections to the inferior colliculus

Brett R Schofield et al. Front Neuroanat. .

Abstract

Experiments in several species have identified direct projections to the medial geniculate nucleus (MG) from cells in subcollicular auditory nuclei. Moreover, many cochlear nucleus cells that project to the MG send collateral projections to the inferior colliculus (IC) (Schofield et al., 2014). We conducted three experiments to characterize projections to the MG from the superior olivary and the lateral lemniscal regions in guinea pigs. For experiment 1, we made large injections of retrograde tracer into the MG. Labeled cells were most numerous in the superior paraolivary nucleus, ventral nucleus of the trapezoid body, lateral superior olivary nucleus, ventral nucleus of the lateral lemniscus, ventrolateral tegmental nucleus, paralemniscal region and sagulum. Additional sources include other periolivary nuclei and the medial superior olivary nucleus. The projections are bilateral with an ipsilateral dominance (66%). For experiment 2, we injected tracer into individual MG subdivisions. The results show that the subcollicular projections terminate primarily in the medial MG, with the dorsal MG a secondary target. The variety of projecting nuclei suggest a range of functions, including monaural and binaural aspects of hearing. These direct projections could provide the thalamus with some of the earliest (i.e., fastest) information regarding acoustic stimuli. For experiment 3, we made large injections of different retrograde tracers into one MG and the homolateral IC to identify cells that project to both targets. Such cells were numerous and distributed across many of the nuclei listed above, mostly ipsilateral to the injections. The prominence of the collateral projections suggests that the same information is delivered to both the IC and the MG, or perhaps that a common signal is being delivered as a preparatory indicator or temporal reference point. The results are discussed from functional and evolutionary perspectives.

Keywords: binaural; brain evolution; lateral lemniscus; medial geniculate nucleus; paralemniscal area; parallel pathways; reticular formation; superior olive.


Figures

Figure 1
Figure 1
Photomicrographs of representative injection sites in the medial geniculate nucleus (MG). (A) Large injection of FluoroGold that involved all MG subdivisions. (B) Small injection of green beads confined to the ventral subdivision of the MG and visualized in a section that was stained for cytochrome oxidase activity (combined fluorescence and brightfield image). (C) Small injection of green beads confined to the medial subdivision of MG (m). Additional green fluorescence is seen around the margins of a blood vessel along the dorsomedial border of the ventral MG (v); this represents spread of beads that does not result in retrogradely labeled cells. (D) Small injection of red beads into the suprageniculate MG (sg). Scale bar in (D) = 0.5 mm and applies to (A–D). Transverse sections; dorsal is up; lateral is to the left in (A,B,D), and to the right in (C). Panels (A,B,D) were originally published in Schofield et al. (2014).
Figure 2
Figure 2
Photographs and plots showing injection sites and the resultant distribution of labeled cells in transverse sections through brainstem auditory nuclei after injection of FluoroGold (FG) into the left MG and green beads (GB) into the left IC. (A) Photomicrographs showing dual injections of green beads into the IC and FluoroGold into the MG. Green beads were deposited at multiple sites in the left IC as shown here in a very caudal section (left section) and a more centrally located section (middle section). IC subdivisions are shown, illustrating the spread of green beads into the lateral cortex (IClc), the dorsal cortex (ICd) and the central nucleus (ICc). The right-most section shows a large injection of FluoroGold into the left MG in the same animal. Case GP597. Scale bar = 1 mm. This panel was originally published in Schofield et al. (2014). (B,C) Plots showing the distribution of labeled cells in subcollicular nuclei after the injections illustrated in (A). (B) Drawings of sections to provide orientation and to indicate nuclear outlines for enlargements shown in (C). Numbers at the lower left of each section correspond to section numbers in (C). (C) Enlargements of the superior olivary complex and lateral lemniscal regions showing locations of labeled cells. Each symbol represents one or more labeled cells. Sections are numbered from caudal to rostral and are spaced 300 μm apart. See list for abbreviations.
Figure 3
Figure 3
Graph showing the distribution of labeled cells in subcollicular auditory nuclei after injection of a retrograde tracer into the medial geniculate nucleus (MG). Each bar shows the percentage of cells (averaged across 5 cases) located in each nucleus. Cross-hatched bars show values for nuclei ipsilateral to the MG injection site and solid bars show values for contralateral nuclei. “Other Tg” indicates scattered cells in intermediate and dorsal nuclei of the lateral lemniscus as well as rostrally and caudally adjacent areas not included in the paralemniscal area. See list for other abbreviations.
Figure 4
Figure 4
Photomicrographs showing labeled cells in the lateral superior olivary nucleus (LSO) after injections into the medial geniculate nucleus (MG) and the inferior colliculus (IC). (A–C) Cells labeled by a large injection of FluoroGold into the left MG (GP597). Labeled cells (yellow arrowheads) are shown ipsilateral (A) or contralateral (B,C) to the injection site. (D,E) Cells labeled by a small injection of green beads into the right MG medial subdivision (MGm). Labeled cells (green arrowheads) are shown ipsilateral (D) and contralateral (E) to the injection site (GP689). (F–I) Single- and double-labeled cells in the LSO after injections of FluoroGold into the left MG and green beads into the left IC (GP597; injection sites shown in Figure 2A). For each panel, the upper half shows cells labeled with FluoroGold and the lower half shows the same area imaged for green beads. White arrows indicate cells that are labeled with both tracers, indicating collateral projections to the two injection sites. Other cells are labeled with only FluoroGold (yellow arrowheads) or green beads (green arrowheads). (F–H) show cells in the LSO ipsilateral to the injections; (I) shows cells contralateral to the injections. Scale bar = 20 μm and applies to all panels. Transverse sections; dorsal is up; lateral is to the left (A,E,F–H) or to the right (B–D,I). Abbreviations: contra, contralateral; ipsi, ipsilateral.
Figure 5
Figure 5
Photomicrographs showing labeled cells in the medial superior olivary nucleus (MSO) after injections into the medial geniculate nucleus (MG) and the inferior colliculus (IC). Panels show FluoroGold (upper image) and green beads (lower image). (A) Single-labeled cells that contained only FluoroGold (yellow arrowheads) or only green beads (green arrowheads). (B) A double-labeled cell (white arrow) contained both tracers. Transverse sections; dorsal is up; lateral is to the left. Scale bar = 20 μm (A) or 10 μm (B). ipsi, ipsilateral.
Figure 6
Figure 6
Photomicrographs showing labeled cells in the left superior paraolivary nucleus (SPN) after injections into the medial geniculate nucleus (MG) and the inferior colliculus (IC). Each panel shows FluoroGold (upper half) and green beads (lower half). (A,B) Double-labeled cells are numerous (white arrows). Additional cells contained only FluoroGold (yellow arrows) or only green beads (green arrowheads). Transverse sections; dorsal is up; lateral is to the left. Scale bar = 20 μm. ipsi, ipsilateral.
Figure 7
Figure 7
Photomicrographs showing labeled cells in the ventral nucleus of the trapezoid body (VTB) after injections into the medial geniculate nucleus (MG) and the inferior colliculus (IC). (A,B) Labeled cells (yellow arrowheads) after a large injection of FluoroGold into the ipsilateral MG (GP597). (C,D) Single- and double-labeled cells in the left VTB after injections of FluoroGold into the left MG and green beads into the left IC (GP597). For each panel, the upper half shows cells labeled with FluoroGold and the lower half shows the same area visualized to see green beads. White arrows indicate cells labeled with both tracers. Other cells are labeled with only FluoroGold (yellow arrowheads) or green beads (unmarked). Scale bar = 20 μm. All panels: transverse sections; dorsal is up; lateral is to the left. Abbreviations: contra, contralateral; ipsi, ipsilateral.
Figure 8
Figure 8
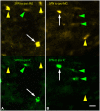
Photomicrographs showing labeled cells in the lateral nucleus of the trapezoid body (LTB) or the medial nucleus of the trapezoid body (MTB) after injections into the medial geniculate nucleus (MG) and the inferior colliculus (IC). (A,B) Cells (yellow arrowheads) in the right LTB labeled by a large injection of FluoroGold into the left MG (GP597). (C,D) Labeled cells (yellow arrowheads) in the right MTB after a large injection of FluoroGold into the left MG (GP597). (E) Cell (green arrowhead) in the left MTB labeled by a small injection of green beads into the right MG medial subdivision (MGm) (GP689). (F,G) Single- and double-labeled cells in the left MTB after injections of FluoroGold into the left MG and green beads into the left IC (GP597). For each panel, the upper half shows cells labeled with FluoroGold and each lower half shows the same area visualized to see green beads. White arrows indicate cells that are labeled with both tracers. Scale bar = 20 μm and applies to all panels. Transverse sections; dorsal is up; lateral is to the right (A–D) or left (E–G). Abbreviations: contra, contralateral; ipsi, ipsilateral.
Figure 9
Figure 9
Photomicrographs showing labeled cells in the left ventral subdivision of the ventral nucleus of the lateral lemniscus (VLLv) after injections into the left medial geniculate nucleus (MG) and the left inferior colliculus (IC) (GP597). Each panel is divided into thirds, with the top part showing FluoroGold label, the middle part showing green bead label and the bottom part showing an overlay of the two images. (A,B) Low magnification images to show both the large number of labeled cells and the range of sizes of the labeled cell bodies. Double-labeled cells were present (white arrowheads), but did not include the largest cells, which were labeled only by FluoroGold (yellow arrowheads in A). (C) Higher magnification images to show double-labeled cells (white arrows) interspersed among cells labeled with only FluoroGold (yellow arrowhead) or green beads (green arrowheads). The double-labeled cells are multipolar cells, one with a multipolar soma (right arrow) and one with an elongate soma (left arrow). The FG-only cell (yellow arrowhead) has a round soma and may be a globular or multipolar cell. Scale bar = 20 μm. All panels: transverse sections; dorsal is up; lateral is to the left. Abbreviations: ipsi, ipsilateral.
Figure 10
Figure 10
Photomicrographs showing labeled cells in the dorsal (VLLd) and anterior (VLLa) subdivisions of the ventral nucleus of the lateral lemniscus after injections into the medial geniculate nucleus (MG) and the inferior colliculus (IC). (A) Cell in the left VLLd labeled after a large injection of FluoroGold into the left MG (GP597). (B–D) Cells in the right VLLd after injection of green beads into the right MG medial subdivision (MGm; GP689). (E) Double-labeled cell (white arrow) in the left VLLd after injections of FluoroGold into the left MG and green beads into the left IC (GP597). (F) Single- and double-labeled cells in the right VLLa after injections of FluoroGold into the left MG and green beads into the left IC (GP597). The upper half shows the cells labeled with FluoroGold and the lower half shows the same area imaged to show green beads. Labeling patterns included double-labeled cells (white arrow) as well as cells that contained only FluoroGold (yellow arrowheads) or only green beads (green arrowheads). Scale bar = 20 μm and applies to all panels. Transverse sections; dorsal is up; lateral is to the left (A,E,F) or right (B–D). Abbreviations: contra, contralateral; ipsi, ipsilateral.
Figure 11
Figure 11
Photomicrographs showing labeled cells in the ventrolateral tegmental nucleus (VLTg) and the paralemniscal area (PL) after injections into the medial geniculate nucleus (MG) and the inferior colliculus (IC). (A–C) Cells in the left VLTg labeled after a large injection of FluoroGold into the left MG (GP597). (D) Large multipolar cell in the right VLTg labeled by an injection of green beads into the ipsilateral MGm (GP689). (E) Single-labeled cells (green and yellow arrowheads) and a double-labeled cell (white arrow) in the left VLTg after injections of FluoroGold into the left MG and green beads into the left IC (GP597). The top panel shows FluoroGold label, the middle panel shows green bead label and the bottom panel shows an overlay of the two images. Most cells were labeled with only FluoroGold (yellow arrowheads) or only green beads (green arrowheads). (F) Double-labeled cell (white arrow) in the left paralemniscal area after injections of FluoroGold into the left MG and green beads into the left IC (GP597). The upper half shows the cell labeled with FluoroGold and the lower half shows the same cell imaged to show green beads. Scale bar = 20 μm and applies to all panels. Transverse sections; dorsal is up; lateral is to the left except for panel (D), where lateral is right. Abbreviations: contra, contralateral; ipsi, ipsilateral.
Figure 12
Figure 12
Photomicrographs showing labeled cells in the sagulum (Sag) after injections into the medial geniculate nucleus (MG) and the inferior colliculus (IC). (A,B) Cells in the left sagulum labeled after a large injection of FluoroGold into the left MG (GP597). (C,D) Double-labeled cells (white arrows) in the left sagulum after injections of FluoroGold into the left MG and green beads into the left IC (GP597). The upper half shows the cells labeled with FluoroGold and the lower half shows the same area visualized to reveal green beads. Single-labeled cells included those with only FluoroGold (yellow arrowheads) or only green beads (green arrowheads). (E) Double labeled cell (white arrow) and cells labeled only with GB (green arrowheads) in the right sagulum after dual injections into the left IC and MG. Scale bars = 20 μm. Transverse sections; dorsal is up; lateral is to the right (A,B,E) or left (C,D). ipsi, ipsilateral.
Figure 13
Figure 13
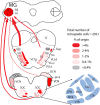
Quantitative graphical summary of the subcollicular projections to the MG. The shading of the nuclei and the thickness of the arrows indicate the relative proportion of retrogradely labeled cells in each nucleus/region after large injections of retrograde tracer into the left MG. Data were analyzed as described for Figure 3; additional data for the cochlear nuclei were obtained from a previous study (Schofield et al., 2014) based on the same cases used presently. The percentages of labeled cells in different nuclei ranged from 0 to 16.4%; these values were arbitrarily divided into five categories and shaded as indicated in the legend. Arrows are drawn from groups of nuclei (left or right cochlear nuclei; superior olivary complex, or lemniscal and adjacent tegmental regions), with the thickness of the arrow representing the relative number of labeled cells in each group. Individual nuclei are named in the cross sections or, for the superior olivary complex (SOC), in the adjacent enlargement. See list of abbreviations.

Similar articles

Cited by

References

    1. Adrian H. O., Goldberg J. M., Brugge J. F. (1966). Auditory evoked cortical potentials after lesions of brachium of inferior colliculus. J. Neurophysiol. 29, 456–466 - PubMed
    1. Anderson L. A., Linden J. F. (2011). Physiological differences between histologically defined subdivisions in the mouse auditory thalamus. Hear Res. 274, 48–60 10.1016/j.heares.2010.12.016 - DOI - PMC - PubMed
    1. Anderson L. A., Malmierca M. S., Wallace M. N., Palmer A. R. (2006). Evidence for a direct, short latency projection from the dorsal cochlear nucleus to the auditory thalamus in the guinea pig. Eur. J. Neurosci. 24, 491–498 10.1111/j.1460-9568.2006.04930.x - DOI - PubMed
    1. Anderson L. A., Wallace M. N., Palmer A. R. (2007). Identification of subdivisions in the medial geniculate body of the guinea pig. Hear Res. 228, 156–167 10.1016/j.heares.2007.02.005 - DOI - PubMed
    1. Angelucci A., Clasca F., Sur M. (1998). Brainstem inputs to the ferret medial geniculate nucleus and the effect of early deafferentation on novel retinal projections to the auditory thalamus. J. Comp. Neurol. 400, 417–439 10.1002/(SICI)1096-9861(19981026)400:3<417::AID-CNE10>3.0.CO;2-O - DOI - PubMed

LinkOut - more resources