

Environmental enrichment alters protein expression as well as the proteomic response to cocaine in rat nucleus accumbens
- PMID: 25100957
- PMCID: PMC4104784
- DOI: 10.3389/fnbeh.2014.00246
Environmental enrichment alters protein expression as well as the proteomic response to cocaine in rat nucleus accumbens
Abstract
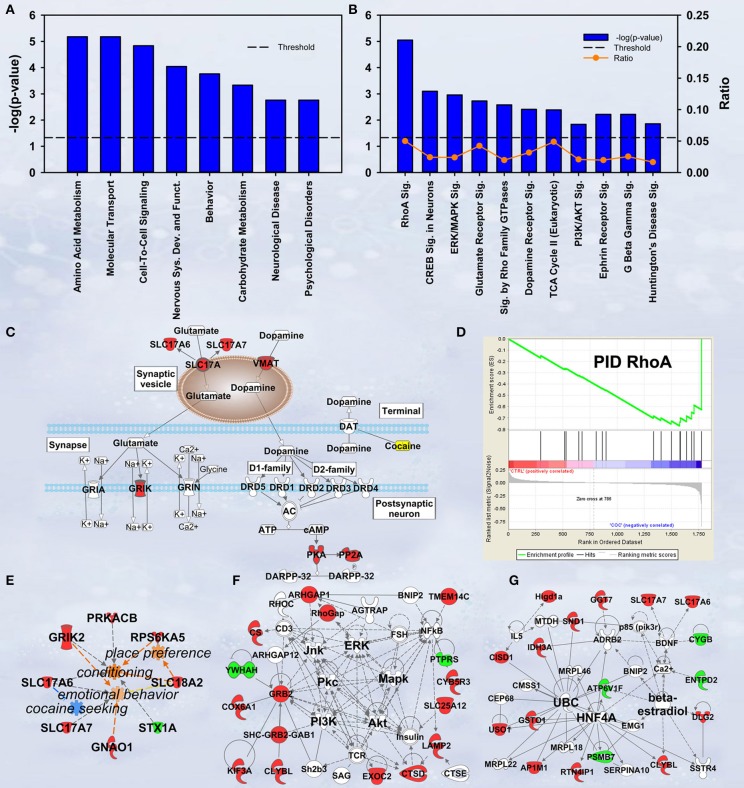
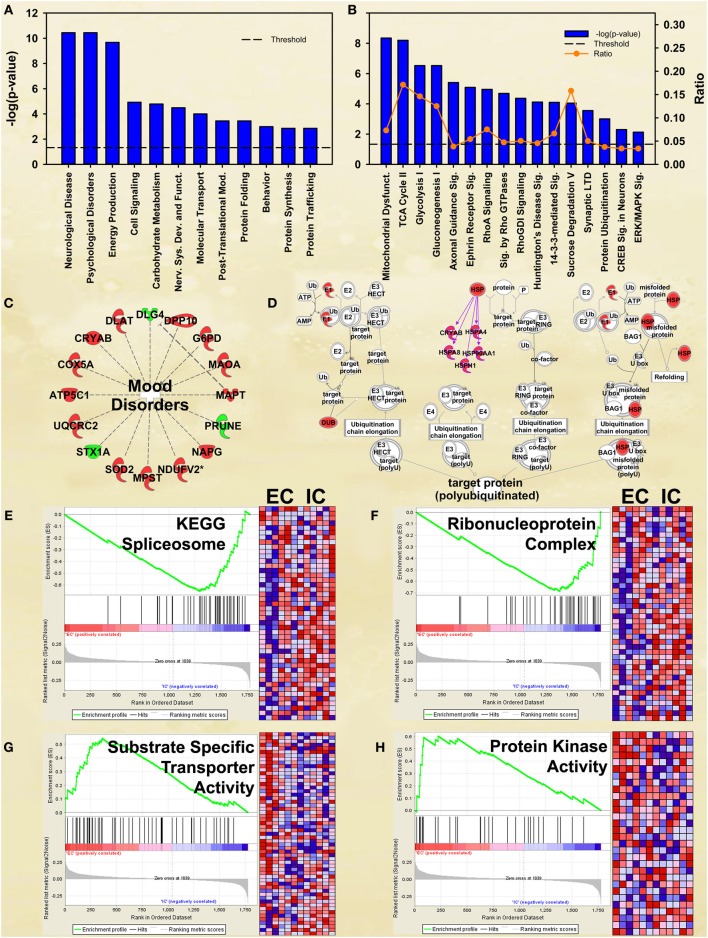
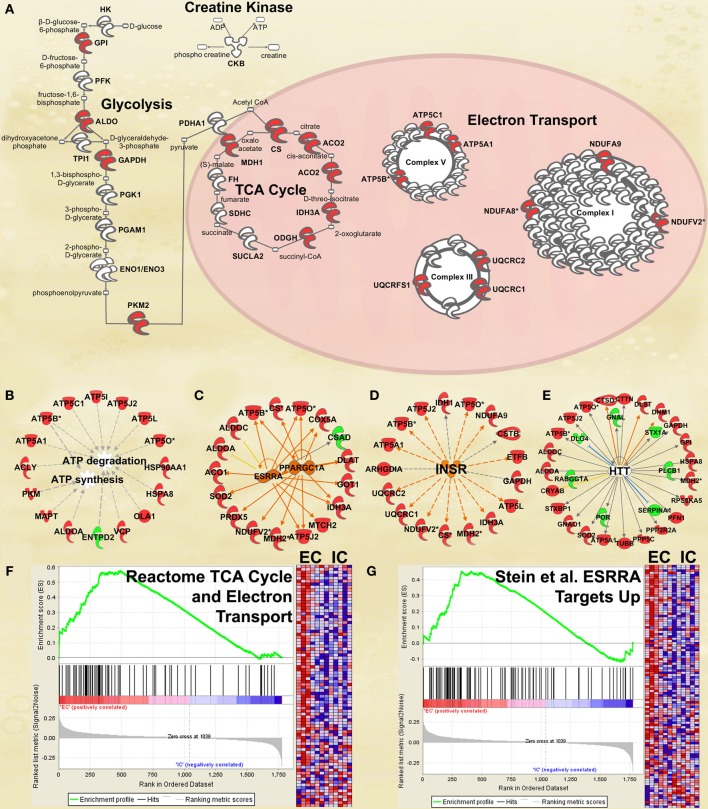
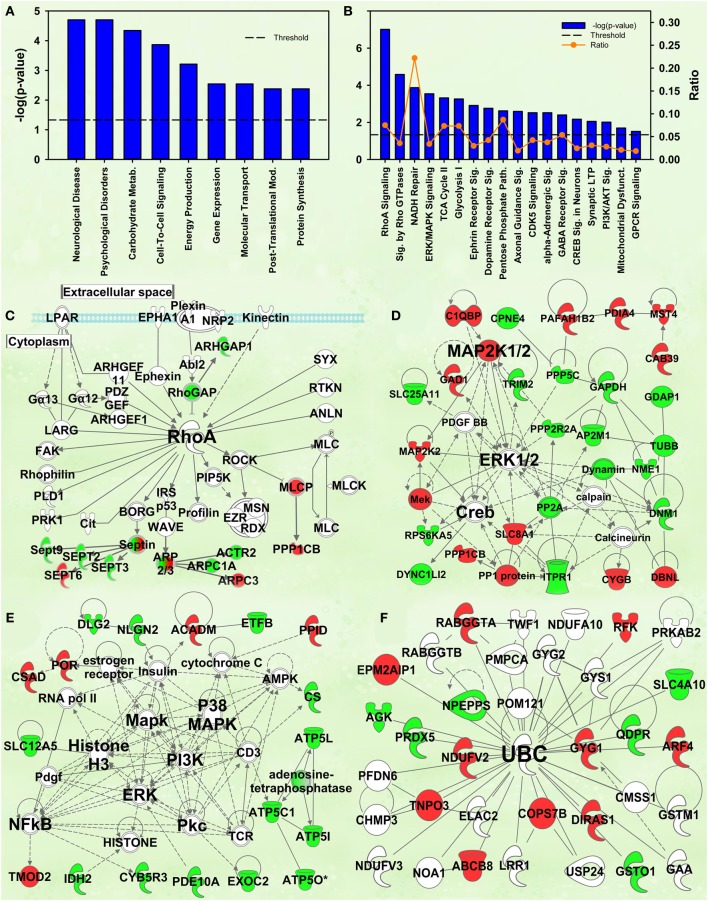
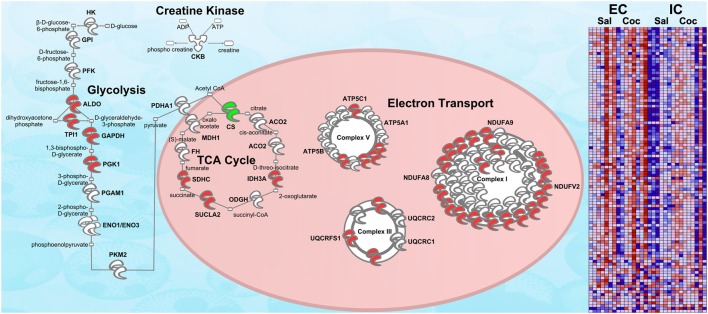
Prior research demonstrated that environmental enrichment creates individual differences in behavior leading to a protective addiction phenotype in rats. Understanding the mechanisms underlying this phenotype will guide selection of targets for much-needed novel pharmacotherapeutics. The current study investigates differences in proteome expression in the nucleus accumbens of enriched and isolated rats and the proteomic response to cocaine self-administration using a liquid chromatography mass spectrometry (LCMS) technique to quantify 1917 proteins. Results of complementary Ingenuity Pathways Analyses (IPA) and gene set enrichment analyses (GSEA), both performed using protein quantitative data, demonstrate that cocaine increases vesicular transporters for dopamine and glutamate as well as increasing proteins in the RhoA pathway. Further, cocaine regulates proteins related to ERK, CREB and AKT signaling. Environmental enrichment altered expression of a large number of proteins implicated in a diverse number of neuronal functions (e.g., energy production, mRNA splicing, and ubiquitination), molecular cascades (e.g., protein kinases), psychiatric disorders (e.g., mood disorders), and neurodegenerative diseases (e.g., Huntington's and Alzheimer's diseases). Upregulation of energy metabolism components in EC rats was verified using RNA sequencing. Most of the biological functions and pathways listed above were also identified in the Cocaine X Enrichment interaction analysis, providing clear evidence that enriched and isolated rats respond quite differently to cocaine exposure. The overall impression of the current results is that enriched saline-administering rats have a unique proteomic complement compared to enriched cocaine-administering rats as well as saline and cocaine-taking isolated rats. These results identify possible mechanisms of the protective phenotype and provide fertile soil for developing novel pharmacotherapeutics. Proteomics data are available via ProteomeXchange with identifier PXD000990.
Keywords: cocaine; differential rearing; drug abuse; drug addiction; label-free quantification; proteomics.
Figures
Similar articles
-
Convergent transcriptomics and proteomics of environmental enrichment and cocaine identifies novel therapeutic strategies for addiction.Neuroscience. 2016 Dec 17;339:254-266. doi: 10.1016/j.neuroscience.2016.09.051. Epub 2016 Oct 4. Neuroscience. 2016. PMID: 27717806 Free PMC article.
-
Transcriptomics of Environmental Enrichment Reveals a Role for Retinoic Acid Signaling in Addiction.Front Mol Neurosci. 2016 Nov 16;9:119. doi: 10.3389/fnmol.2016.00119. eCollection 2016. Front Mol Neurosci. 2016. PMID: 27899881 Free PMC article.
-
Overexpression of DeltaFosB in nucleus accumbens mimics the protective addiction phenotype, but not the protective depression phenotype of environmental enrichment.Front Behav Neurosci. 2014 Aug 29;8:297. doi: 10.3389/fnbeh.2014.00297. eCollection 2014. Front Behav Neurosci. 2014. PMID: 25221490 Free PMC article.
-
Reflections on: "A general role for adaptations in G-Proteins and the cyclic AMP system in mediating the chronic actions of morphine and cocaine on neuronal function".Brain Res. 2016 Aug 15;1645:71-4. doi: 10.1016/j.brainres.2015.12.039. Epub 2015 Dec 29. Brain Res. 2016. PMID: 26740398 Free PMC article. Review.
-
Role of oxytocin in the neuroadaptation to drugs of abuse.Psychoneuroendocrinology. 1994;19(1):85-117. doi: 10.1016/0306-4530(94)90062-0. Psychoneuroendocrinology. 1994. PMID: 9210215 Review.
Cited by
-
Environmental enrichment during forced abstinence from cocaine self-administration opposes gene network expression changes associated with the incubation effect.Sci Rep. 2020 Jul 9;10(1):11291. doi: 10.1038/s41598-020-67966-8. Sci Rep. 2020. PMID: 32647308 Free PMC article.
-
Manipulation of retinoic acid signaling in the nucleus accumbens shell alters rat emotional behavior.Behav Brain Res. 2019 Dec 30;376:112177. doi: 10.1016/j.bbr.2019.112177. Epub 2019 Aug 23. Behav Brain Res. 2019. PMID: 31449909 Free PMC article.
-
Environmental Enrichment Induces Epigenomic and Genome Organization Changes Relevant for Cognition.Front Mol Neurosci. 2021 May 5;14:664912. doi: 10.3389/fnmol.2021.664912. eCollection 2021. Front Mol Neurosci. 2021. PMID: 34025350 Free PMC article.
-
Inoculation stress hypothesis of environmental enrichment.Neurosci Biobehav Rev. 2015 Feb;49:19-31. doi: 10.1016/j.neubiorev.2014.11.017. Epub 2014 Nov 29. Neurosci Biobehav Rev. 2015. PMID: 25449533 Free PMC article. Review.
-
A bibliometric analysis of studies on environmental enrichment spanning 1967-2024: patterns and trends over the years.Front Behav Neurosci. 2024 Dec 4;18:1501377. doi: 10.3389/fnbeh.2024.1501377. eCollection 2024. Front Behav Neurosci. 2024. PMID: 39697184 Free PMC article.
References
-
- Alsio J., Nordenankar K., Arvidsson E., Birgner C., Mahmoudi S., Halbout B., et al. (2011). Enhanced sucrose and cocaine self-administration and cue-induced drug seeking after loss of VGLUT2 in midbrain dopamine neurons in mice. J. Neurosci. 31, 12593–12603 10.1523/JNEUROSCI.2397-11.2011 - DOI - PMC - PubMed
-
- Andrews S. (2014). FastQC: A Quality Control Tool for High Throughput Sequence Data. Available online at: http://www.bioinformatics.babraham.ac.uk/projects/fastqc/
Grants and funding
LinkOut - more resources
Full Text Sources
Other Literature Sources
Molecular Biology Databases
Miscellaneous