A new method to determine reflex latency induced by high rate stimulation of the nervous system
- PMID: 25100978
- PMCID: PMC4103404
- DOI: 10.3389/fnhum.2014.00536
A new method to determine reflex latency induced by high rate stimulation of the nervous system
Abstract
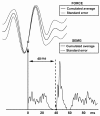
High rate stimulations of the neuromuscular system, such as continuous whole body vibration, tonic vibration reflex and high frequency electrical stimulation, are used in the physiological research with an increasing interest. In these studies, the neuronal circuitries underlying the reflex responses remain unclear due to the problem of determining the exact reflex latencies. We present a novel "cumulated average method" to determine the reflex latency during high rate stimulation of the nervous system which was proven to be significantly more accurate than the classical method. The classical method, cumulant density analysis, reveals the relationship between the two synchronously recorded signals as a function of the lag between the signals. The comparison of new method with the classical technique and their relative accuracy was tested using a computer simulation. In the simulated signals the EMG response latency was constructed to be exactly 40 ms. The new method accurately indicated the value of the simulated reflex latency (40 ms). However, the classical method showed that the lag time between the simulated triggers and the simulated signals was 49 ms. Simulation results illustrated that the cumulated average method is a reliable and more accurate method compared with the classical method. We therefore suggest that the new cumulated average method is able to determine the high rate stimulation induced reflex latencies more accurately than the classical method.
Keywords: EMG; averaging; cumulated density; human; reflex latency determination.
Figures


Similar articles
-
A reliability study on the cumulative averaging method for estimating effective stimulus time in vibration studies.J Electromyogr Kinesiol. 2023 Jun;70:102768. doi: 10.1016/j.jelekin.2023.102768. Epub 2023 Mar 20. J Electromyogr Kinesiol. 2023. PMID: 36965288
-
High-frequency whole-body vibration activates tonic vibration reflex.Turk J Phys Med Rehabil. 2023 Jan 11;69(1):46-51. doi: 10.5606/tftrd.2023.10854. eCollection 2023 Mar. Turk J Phys Med Rehabil. 2023. PMID: 37201009 Free PMC article.
-
Short and long latency reflexes in human muscles following electrical and mechanical stimulation.Acta Physiol Scand Suppl. 1986;557:1-32. Acta Physiol Scand Suppl. 1986. PMID: 3469889
-
Phasic and tonic reflexes evoked in human antagonistic wrist muscles by tendon vibration.Electroencephalogr Clin Neurophysiol. 1998 Feb;109(1):24-35. doi: 10.1016/s0924-980x(97)00063-5. Electroencephalogr Clin Neurophysiol. 1998. PMID: 11003061
-
Differential effects of low-frequency depression, vibration-induced inhibition, and posttetanic potentiation on H-reflexes and tendon jerks in the human soleus muscle.J Neurophysiol. 1986 Mar;55(3):551-68. doi: 10.1152/jn.1986.55.3.551. J Neurophysiol. 1986. PMID: 3514814 Review.
Cited by
-
Whole-body vibration-induced muscular reflex: Is it a stretch-induced reflex?J Phys Ther Sci. 2015 Jul;27(7):2279-84. doi: 10.1589/jpts.27.2279. Epub 2015 Jul 22. J Phys Ther Sci. 2015. PMID: 26310784 Free PMC article.
-
Exploring the receptor origin of vibration-induced reflexes.Spinal Cord. 2020 Jun;58(6):716-723. doi: 10.1038/s41393-020-0419-5. Epub 2020 Jan 15. Spinal Cord. 2020. PMID: 31942042
-
Frequency characteristics of human muscle and cortical responses evoked by noisy Achilles tendon vibration.J Appl Physiol (1985). 2017 May 1;122(5):1134-1144. doi: 10.1152/japplphysiol.00908.2016. Epub 2017 Feb 16. J Appl Physiol (1985). 2017. PMID: 28209741 Free PMC article.
-
The reflex mechanism underlying the neuromuscular effects of whole-body vibration: Is it the tonic vibration reflex?J Musculoskelet Neuronal Interact. 2022 Mar 1;22(1):37-42. J Musculoskelet Neuronal Interact. 2022. PMID: 35234157 Free PMC article.
-
Brief skin cooling modulates the reflexes generated by whole-body vibration.Eur J Appl Physiol. 2025 Apr 13. doi: 10.1007/s00421-025-05784-4. Online ahead of print. Eur J Appl Physiol. 2025. PMID: 40223007
References
-
- Halliday D. M., Rosenberg J. R., Amjad A. M., Breeze P., Conway B. A., Farmer S. F. (1995). A framework for the analysis of mixed time series/point process data—theory and application to the study of physiological tremor, single motor unit discharges and electromyograms. Prog. Biophys. Mol. Biol. 64, 237–278 10.1016/s0079-6107(96)00009-0 - DOI - PubMed
-
- Halliday D. M., Rosenberg J. R. (1999). “Time and frequency domain analysis of spike train and time series data,” in Modern Techniques in Neuroscience Research, eds Windhorst U., Johansson H. (Berlin Heidelberg: Springer; ), 503–543
-
- Halliday D. M. (2008). NeuroSpec 2.0 user guide. http://www.neurospec.org/neurospec20.pdf
LinkOut - more resources
Full Text Sources
Other Literature Sources
Medical

