. 2014 Jul 23:6:167.
doi: 10.3389/fnagi.2014.00167. eCollection 2014.

DWI and complex brain network analysis predicts vascular cognitive impairment in spontaneous hypertensive rats undergoing executive function tests

Affiliations

DWI and complex brain network analysis predicts vascular cognitive impairment in spontaneous hypertensive rats undergoing executive function tests

Xavier López-Gil et al. Front Aging Neurosci. .

Abstract

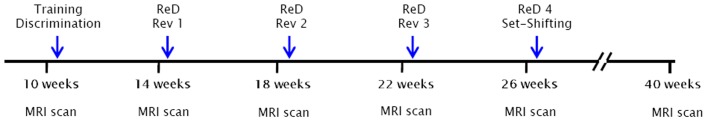
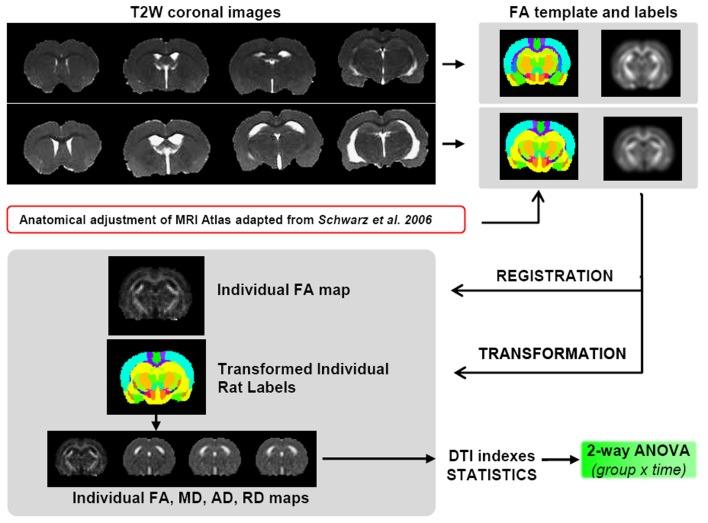
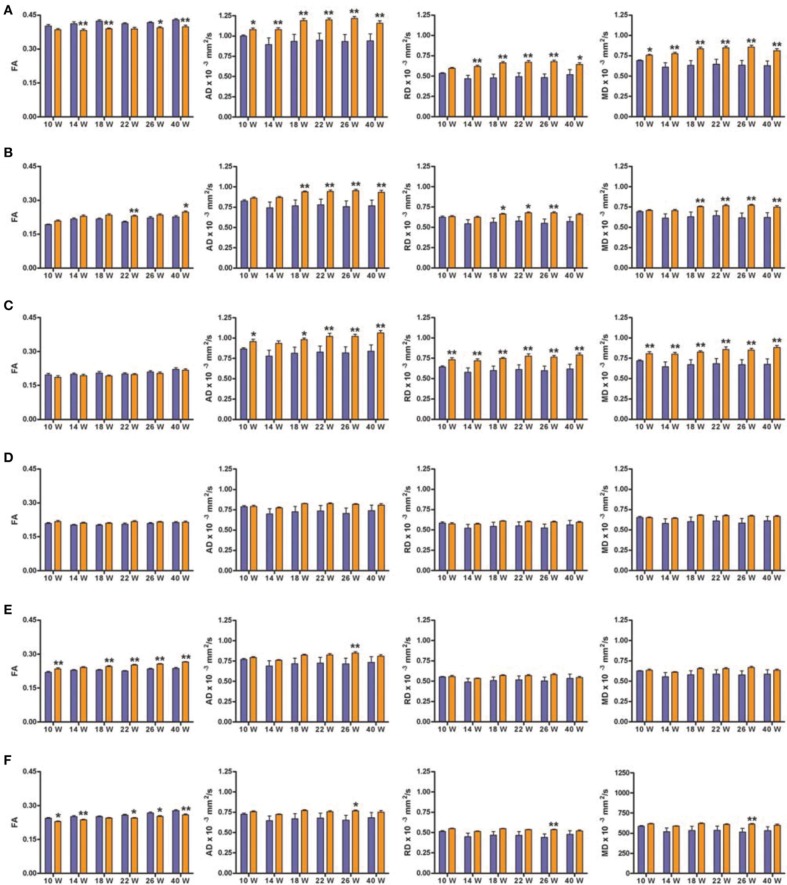
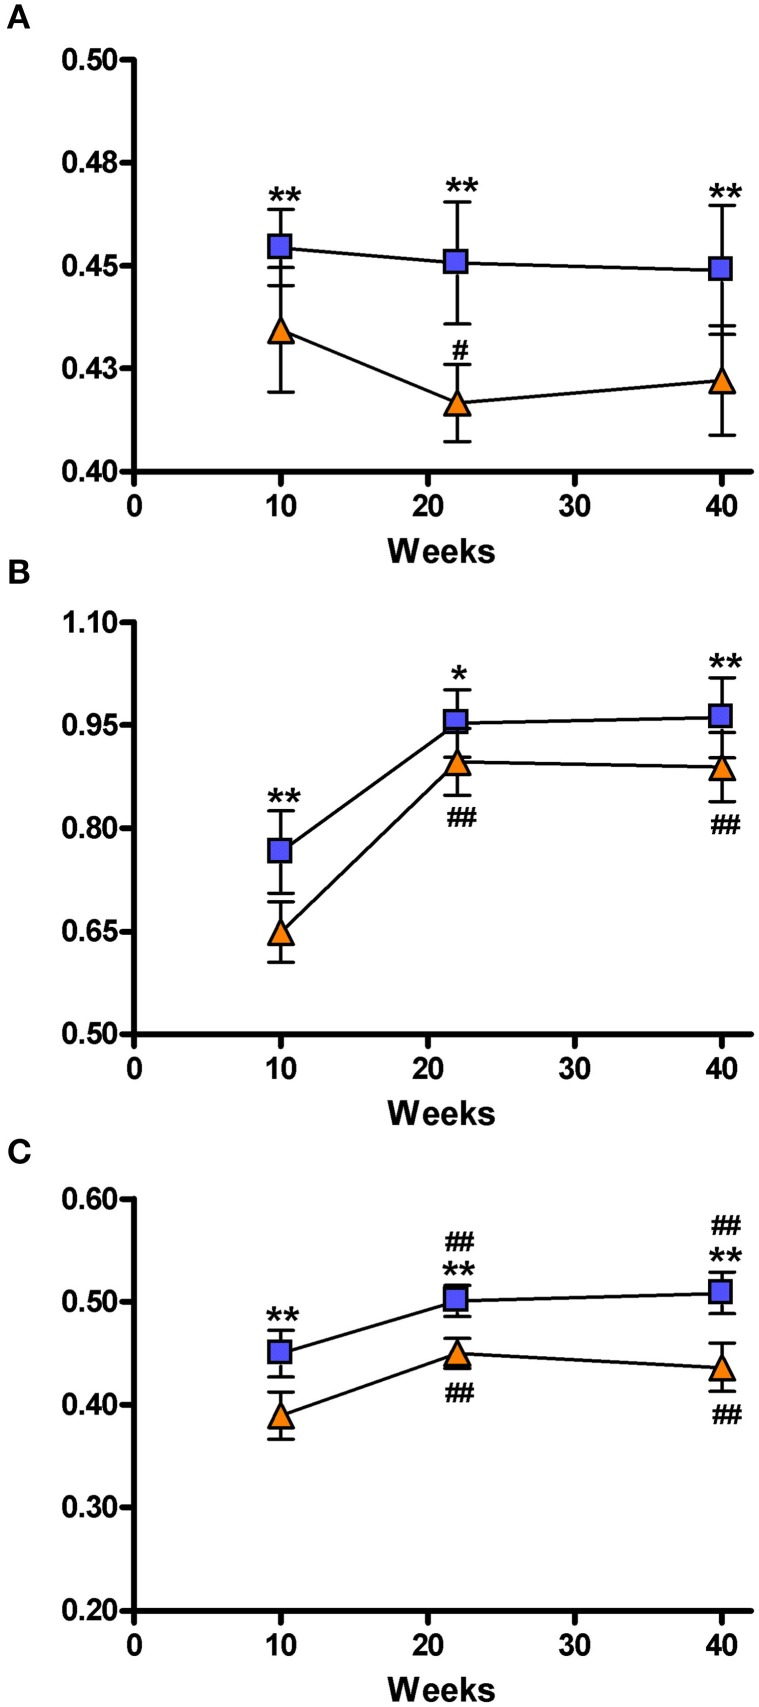
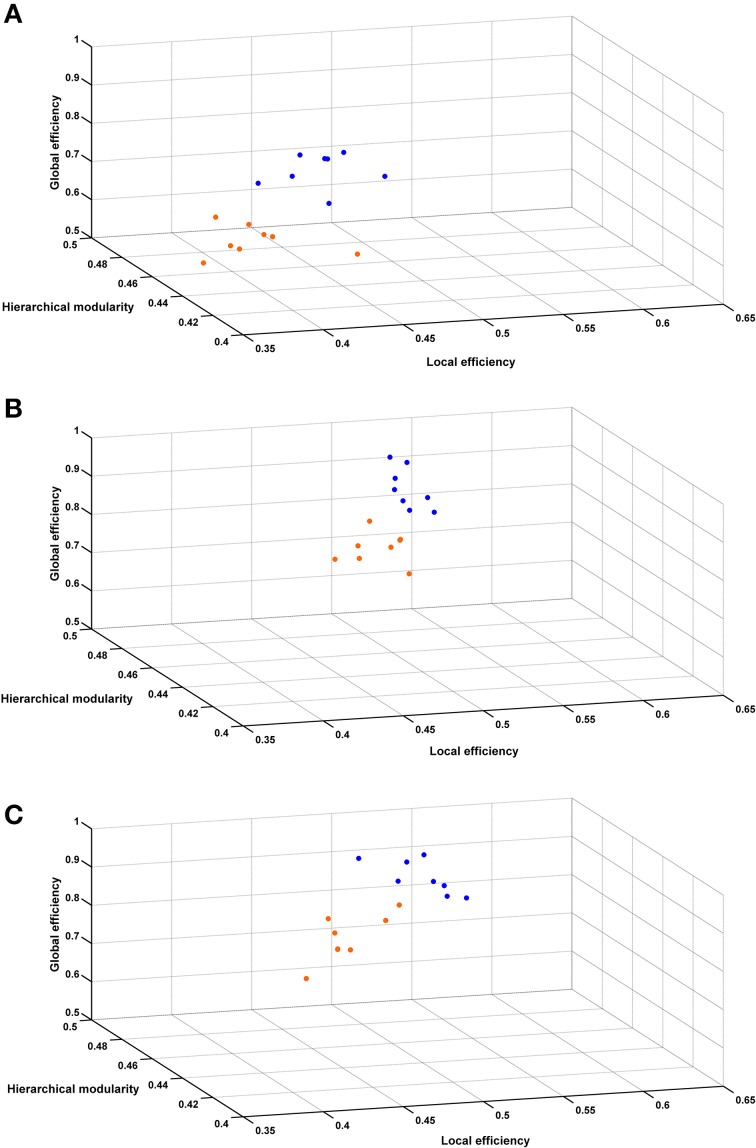
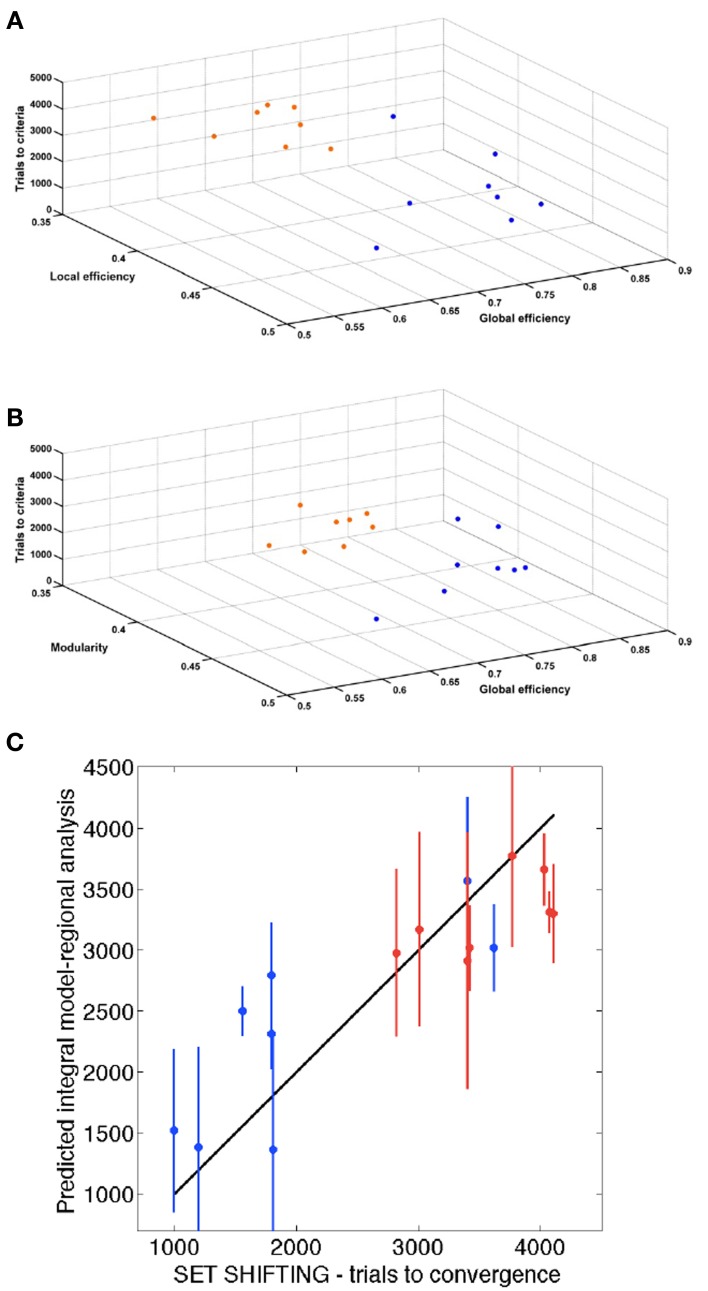
The identification of biomarkers of vascular cognitive impairment is urgent for its early diagnosis. The aim of this study was to detect and monitor changes in brain structure and connectivity, and to correlate them with the decline in executive function. We examined the feasibility of early diagnostic magnetic resonance imaging (MRI) to predict cognitive impairment before onset in an animal model of chronic hypertension: Spontaneously Hypertensive Rats. Cognitive performance was tested in an operant conditioning paradigm that evaluated learning, memory, and behavioral flexibility skills. Behavioral tests were coupled with longitudinal diffusion weighted imaging acquired with 126 diffusion gradient directions and 0.3 mm(3) isometric resolution at 10, 14, 18, 22, 26, and 40 weeks after birth. Diffusion weighted imaging was analyzed in two different ways, by regional characterization of diffusion tensor imaging (DTI) indices, and by assessing changes in structural brain network organization based on Q-Ball tractography. Already at the first evaluated times, DTI scalar maps revealed significant differences in many regions, suggesting loss of integrity in white and gray matter of spontaneously hypertensive rats when compared to normotensive control rats. In addition, graph theory analysis of the structural brain network demonstrated a significant decrease of hierarchical modularity, global and local efficacy, with predictive value as shown by regional three-fold cross validation study. Moreover, these decreases were significantly correlated with the behavioral performance deficits observed at subsequent time points, suggesting that the diffusion weighted imaging and connectivity studies can unravel neuroimaging alterations even overt signs of cognitive impairment become apparent.

Keywords: DTI; DWI; animal models; connectomics; executive function; hypertension; in-vivo MRI; vascular cognitive impairment.


Figures

Figure 1
Figure 1
Timeline of the experimental design. Six MRI time points were analyzed that corresponded to 10, 14, 18, 22, 26, and 40 weeks of age. The blue arrows indicate the cognitive tests that started a week after each MRI scan. All 23 animals (11 control and 12 SHR) underwent the MRI scans. Of those same animals, 16 (8 control and 8 SHR) performed the behavioral tests. ReD, re-discrimination; Rev, reversal learning.
Figure 2
Figure 2
Scheme of the DTI data processing. SHRs have enlarged ventricles compared to control animals, thus it is not viable to perform the registration process for a unified voxel based analysis. Therefore, two different FA templates were created, one for controls and one for SHRs, including a corresponding atlas of neuroanatomical structures. To avoid interpolation of the original data, the template was registered to the individual FA maps, and this transformation was applied to the corresponding atlas to obtain the values of the 4 DTI indexes (FA, MD, AD, and RD) for both SHR and Wistar rats for each of the ROI contained in the atlas.
Figure 3
Figure 3
Number of trials to reach criteria in the behavioral tests. (A) Discrimination (10 weeks) and re-discrimination (14, 18, 22, and 26 weeks); (B) reversal learning, and (C) set-shifting test. Blue bars represents control animals (n = 8) and orange bars SHR (n = 8). Data is represented as mean ± s.e.m. Asterisks indicate differences between groups (Bonferroni test). *P < 0.01.
Figure 4
Figure 4
DTI scalar map analysis. The four indices FA, AD, RD, and MD are indicated for each of the six structures analyzed at each of the six scanning time points. Blue bars represents control animals (n = 11) and orange bars SHR group (n = 12). (A) Corpus Callosum, (B) medial Prefrontal Cortex, (C) Hippocampus antero-dorsal, (D) Orbitofrontal Cortex, (E) Striatum, (F) Nucleus Accumbens. Data is represented as mean ± s.e.m. Asterisks indicate differences between groups (Bonferroni test) *P < 0.05, **P < 0.01.
Figure 5
Figure 5
Representation of the brain network connectivity. Network connectivity indices at 10, 22, and 40 weeks. (A) Hierarchical modularity; (B) Global Efficiency; (C) Local efficiency. The blue squares represents the control animals and the orange triangles the SHRs. Data is represented as mean ± s.e.m. Asterisks indicate differences between groups (Bonferroni test) *P < 0.05, **P < 0.01. Hash tags indicate differences to 10 weeks (Bonferroni test) #P < 0.05, ##P < 0.01.
Figure 6
Figure 6
Hierarchical modularity, global and local efficiency indices. Three-dimensional scatter plots of all animals represented by their connectivity indexes at (A) 10 weeks, (B) 22 weeks, (C) 40 weeks. Blue dots represent control animals and orange dots represent SHRs.
Figure 7
Figure 7
Association of behavior and connectivity indices. (A,B) Scatter plots representing all the animals with the number of trials required to reach criteria in the set-shifting test on the Y axis, and the connectivity indexes in the X and Z axis. Blue dots represent control animals and orange dots represent SHR. (C) Estimation of the final behavioral flexibility score of each animal based on the connectivity indexes at 10 weeks.

References

    1. Amenta F., Antonietta M., Tullio D., Tomassoni D. (2003). Arterial hypertension and brain damage—evidence from animal models (review). Hypertension 25, 359–380 10.1007/978-1-60761-898-0_30 - DOI - PubMed
    1. Babikian V., Ropper A. H. (1987). Binswanger's disease: a review. Stroke 18, 2–12 10.1161/01.STR.18.1.2 - DOI - PubMed
    1. Basser P. J., Pajevic S., Pierpaoli C., Duda J., Aldroubi A. (2000). In vivo fiber tractography using DT-MRI data. Magn. Reson. Med. 44, 625–632 10.1002/1522-2594(200010)44:4<625::AID-MRM17>3.0.CO;2-O - DOI - PubMed
    1. Bassett D. S., Bullmore E. (2006). Small-world brain networks. Neuroscientist 12, 512–523 10.1177/1073858406293182 - DOI - PubMed
    1. Batalle D., Eixarch E., Figueras F., Muñoz-moreno E., Bargallo N. (2012). NeuroImage Altered small-world topology of structural brain networks in infants with intrauterine growth restriction and its association with later neurodevelopmental outcome. Neuroimage 60, 1352–1366 10.1016/j.neuroimage.2012.01.059 - DOI - PubMed