. 2014 Jul 18:5:340.
doi: 10.3389/fimmu.2014.00340. eCollection 2014.

Next generation sequencing reveals skewing of the T and B cell receptor repertoires in patients with wiskott-Aldrich syndrome

Affiliations

Next generation sequencing reveals skewing of the T and B cell receptor repertoires in patients with wiskott-Aldrich syndrome

Amy E O'Connell et al. Front Immunol. .

Abstract

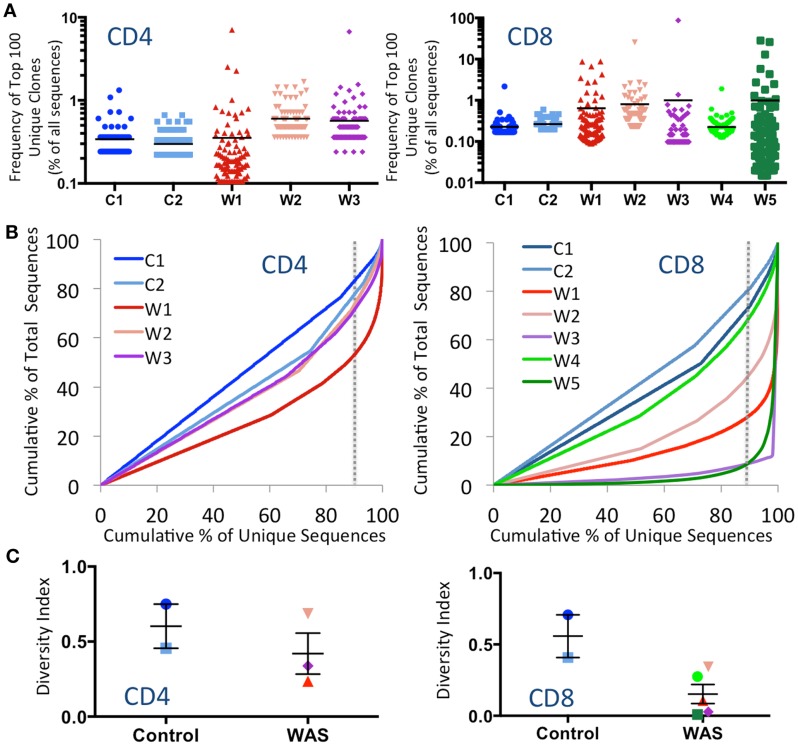
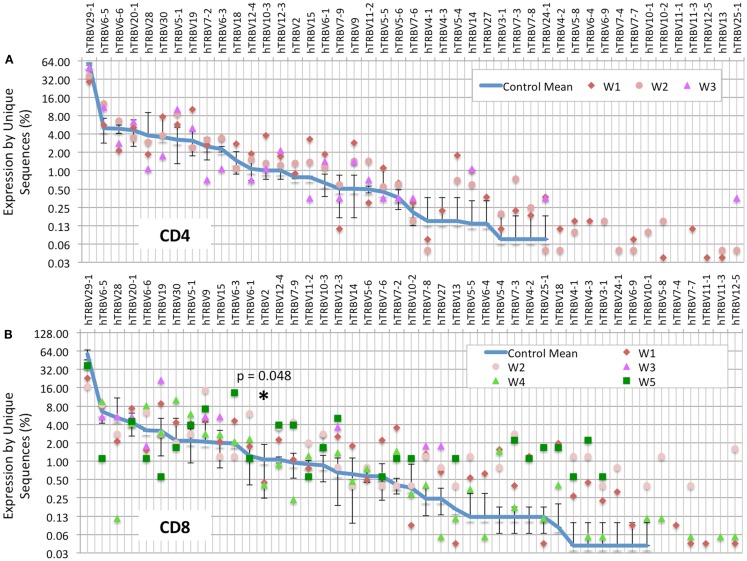
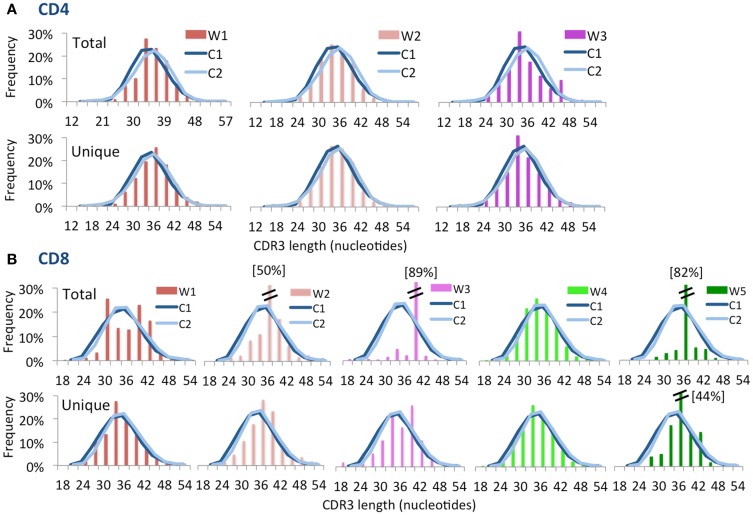
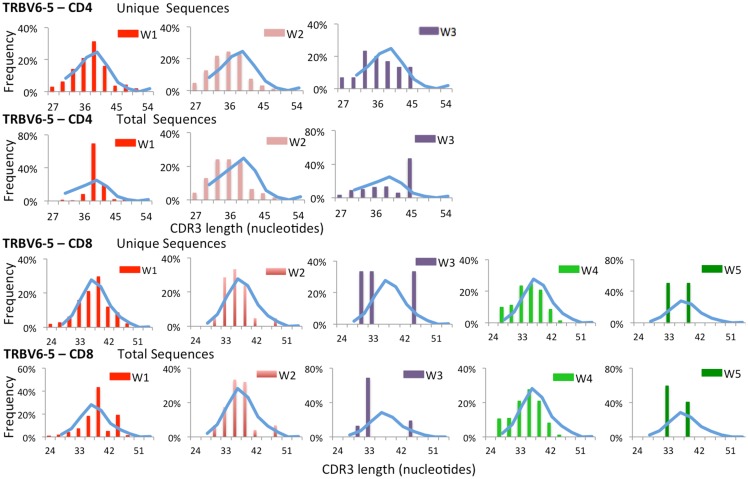
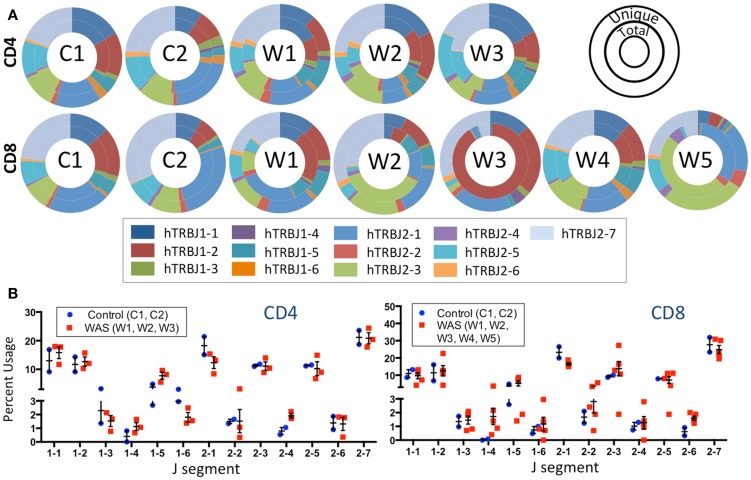
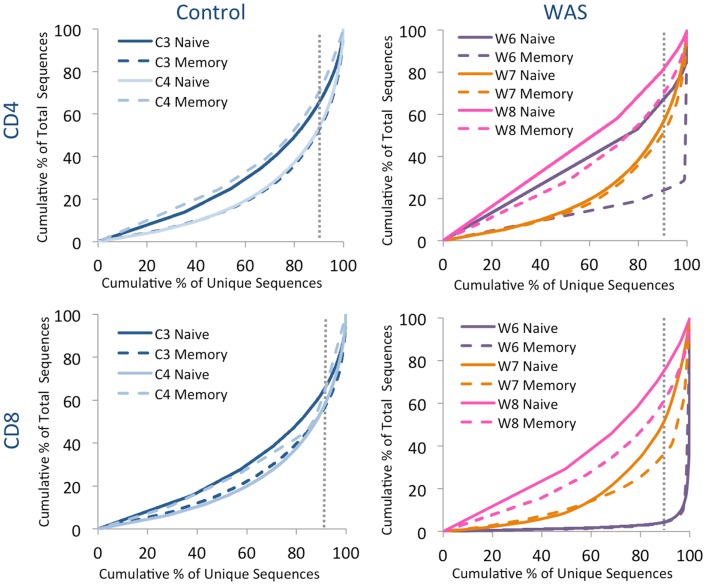
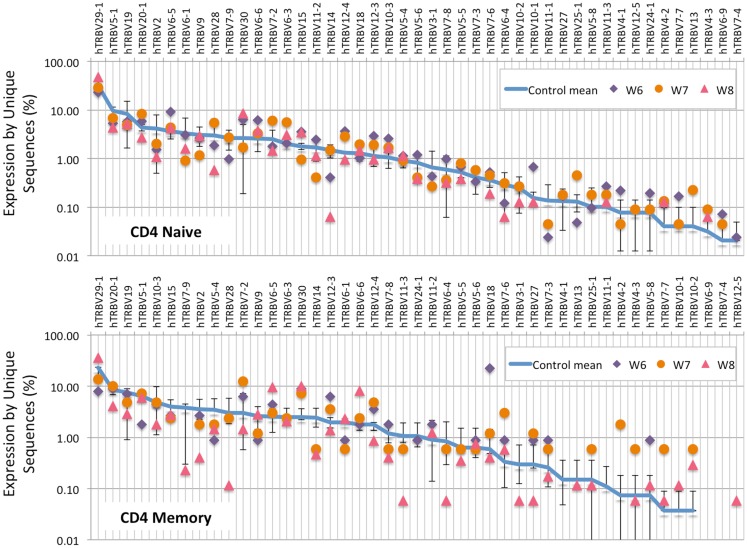
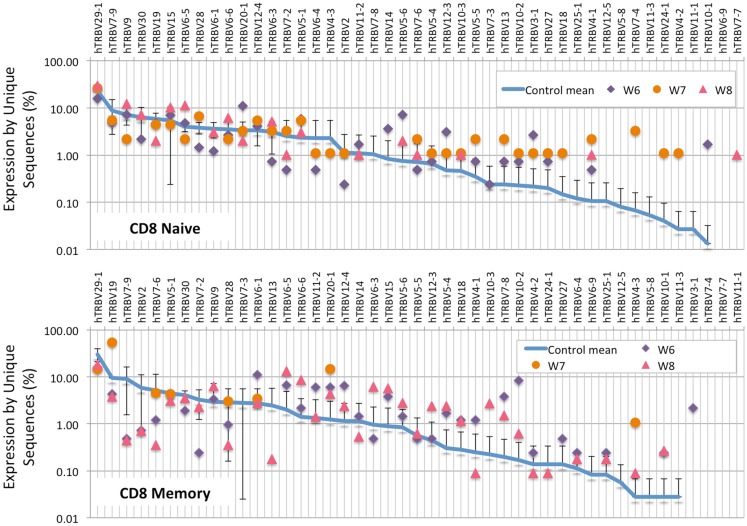
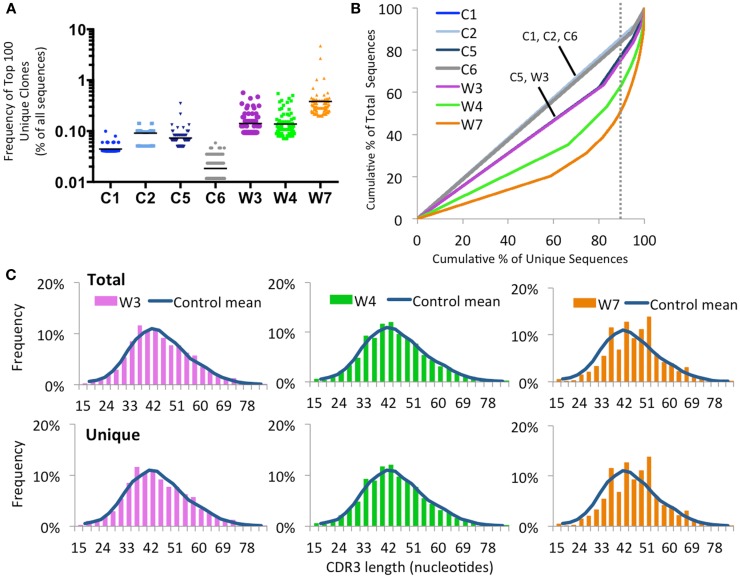
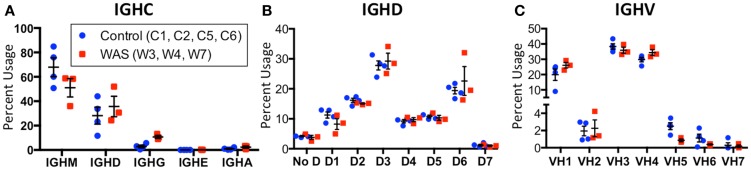
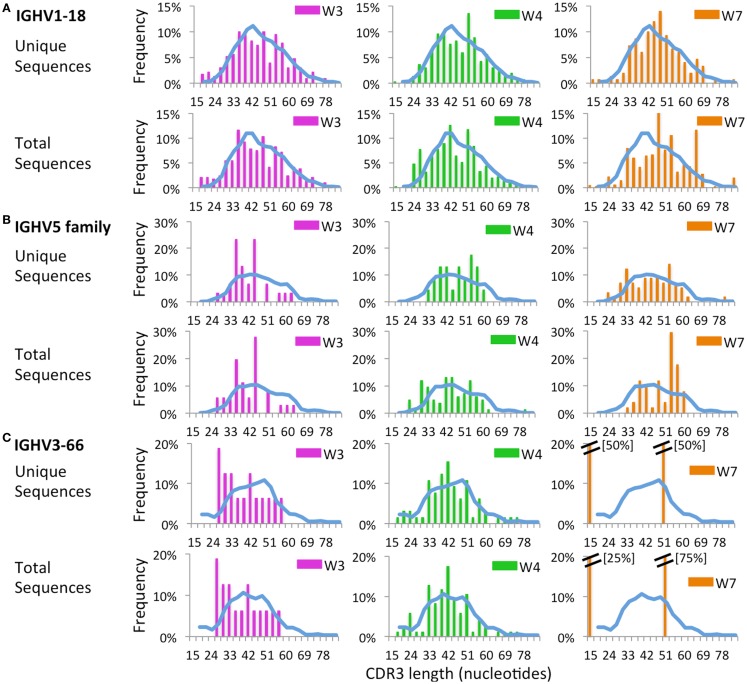
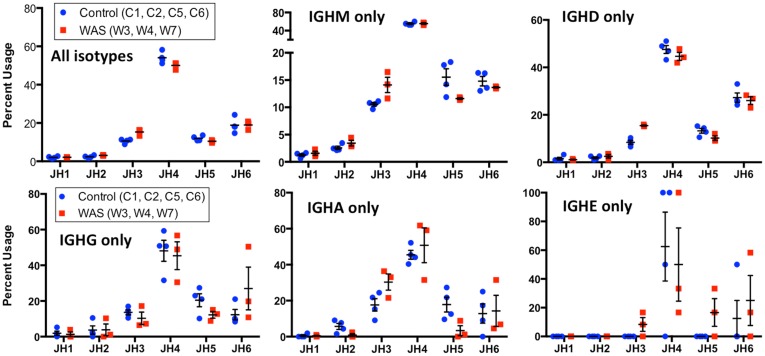
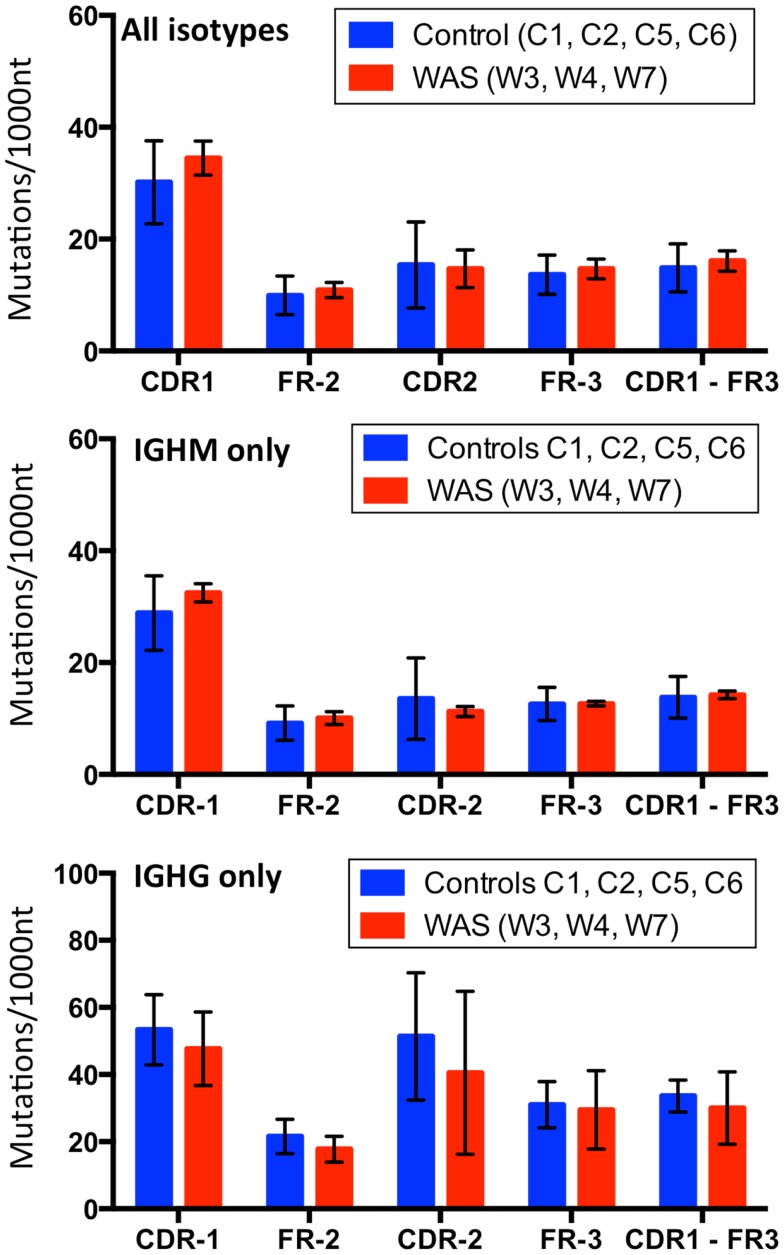
The Wiskott-Aldrich syndrome (WAS) is due to mutations of the WAS gene encoding for the cytoskeletal WAS protein, leading to abnormal downstream signaling from the T cell and B cell antigen receptors (TCR and BCR). We hypothesized that the impaired signaling through the TCR and BCR in WAS would subsequently lead to aberrations in the immune repertoire of WAS patients. Using next generation sequencing (NGS), the T cell receptor β and B cell immunoglobulin heavy chain (IGH) repertoires of eight patients with WAS and six controls were sequenced. Clonal expansions were identified within memory CD4(+) cells as well as in total, naïve and memory CD8(+) cells from WAS patients. In the B cell compartment, WAS patient IGH repertoires were also clonally expanded and showed skewed usage of IGHV and IGHJ genes, and increased usage of IGHG constant genes, compared with controls. To our knowledge, this is the first study that demonstrates significant abnormalities of the immune repertoire in WAS patients using NGS.

Keywords: B cell receptor; T cell receptor; Wiskott–Aldrich syndrome; clonotypic expansion; deep sequencing; immune repertoire; next generation sequencing; somatic hypermutation.


Figures

Figure 1
Figure 1
Clonal expansions and diversity of the CD4+ and CD8+ TRB repertoire. (A) The relative frequency of the 100 most abundant clones is displayed as a proportion of the total sequences for both CD4+ (left panel) and CD8+ (right panel) populations. The black line indicates the mean of the sample. (B) The degree of clonal expansion for CD4+ and CD8+ populations is displayed by plotting the cumulative percentage of unique clones (x) vs. the cumulative percentage of total sequences (y). A slope of one would indicate an even distribution of clonotypes. The dotted gray vertical line indicates 90% of cumulative unique sequences, with sequences to the right of the line corresponding to the top 10% most abundant unique clonotypes. (C) The diversity of each patient’s repertoire was determined by dividing the number of unique sequences over the total sequences for CD4+ and CD8+ populations. Bars represent mean and SE. In all panels, the same color is used to identify individual control subjects and patients.
Figure 2
Figure 2
TRBV gene usage is skewed in the CD8+ population of WAS patients. The frequency of usage of individual TRBV genes among unique TRB sequences is displayed for the CD4+ (A) or CD8+ (B) cells. The blue line indicates the average frequency of the two control subjects, and the error bars indicate the SD of the frequency of the controls. p Values were calculated using Mann–Whitney test between controls and WAS for each V segment. *p < 0.05.
Figure 3
Figure 3
Complementarity determining region 3 length distribution of unique and total sequences for CD4+ and CD8+ TRB repertoire. Distribution of CDR3 nucleotide length frequencies of CD4+ (A) and CD8+ (B) populations for both total and unique clones for each WAS patient compared to control subjects C1 and C2 (shown as curves). A double bar indicates the value of the bar has exceeded the axis limit, and the maximum value is indicated within brackets.
Figure 4
Figure 4
Complementarity determining region 3 length analysis of TRBV6-5 expressing clonotypes subgroups. Length distribution of the CDR3 region of unique and total clones containing TRBV6-5 in both CD4 and CD8 populations from WAS patients (bars) and controls (blue line).
Figure 5
Figure 5
J segment usage is skewed in the TRB repertoire of CD8+ cells in WAS patients. (A) Donut graphs compare the representative frequencies of TRBJ segment usage for total (inner ring) and unique (outer ring) sequences for controls and WAS patients (see also inset key). (B) Direct comparison of J segment usage between WAS patients and controls.
Figure 6
Figure 6
Clonal expansion of the TRB repertoire in CD4+ and CD8+ naïve and memory lymphocytes. The degree of clonal expansion for each patient’s repertoire is displayed by plotting the cumulative percentage of unique sequences (x) vs. the cumulative percentage of total sequences (y) in controls (left panels) and patients (right panels). A slope of one would indicate an even distribution of clonotypes. The dotted gray vertical line indicates 90% of cumulative unique sequences, with sequences to the right of the line corresponding to the top 10% most abundant clonotypes.
Figure 7
Figure 7
TRBV gene usage in CD4+ naive and memory lymphocytes from healthy controls and patients with WAS. The frequency of usage of individual TRBV genes in unique TRB sequences is displayed for CD4+ naïve (top panel) or memory (bottom panel) lymphocytes. The blue line indicates the average frequency of the two control patients, and the error bars indicate the SD of the frequency of the controls.
Figure 8
Figure 8
TRBV gene in CD8+ naive and memory lymphocytes from healthy controls and patients with WAS. The frequency of usage of individual TRBV genes in unique TRB sequences is displayed for CD8+ naïve (top panel) or memory (bottom panel) lymphocytes. The blue line indicates the average frequency of the two control patients, and the error bars indicate the SD of the frequency of the controls.
Figure 9
Figure 9
Clonal expansion of the IGH repertoire in circulating CD19+ lymphocytes. (A) The relative frequency of the 100 most abundant clones is displayed as a proportion of the total sequences in four healthy controls (C1–C4) and three WAS patients (W3, W4, and W7). The black line indicates the mean of the sample. (B) The degree of clonal expansion for each patient’s repertoire is displayed by plotting the cumulative percentage of unique clones (x) vs. the cumulative percentage of total sequences (y). A slope of one would indicate an even distribution of clonotypes. The dotted gray vertical line indicates 90% of cumulative unique sequences, with sequences to the right of the line corresponding to the top 10% most abundant clonotypes. (C) Distribution of CDR3 nucleotide length frequencies for both total and unique sequences in individual WAS patients compared to the mean in controls C1 and C2 (shown as a curve).
Figure 10
Figure 10
Usage of IGHV, IGHD, and IGHC families in circulating B cells from controls and WAS patients. Percent usage of V (A), D (B), and constant (C) segment families in unique IGH clonotypes is shown for both controls (blue dots) and WAS patients (red squares). Bars indicate the mean and SE.
Figure 11
Figure 11
Individual IGHV gene usage in circulating CD19+ cells from WAS patients and controls. The frequency of usage of individual IGHV genes in unique IGH sequences is displayed. Boxes indicate the high, low, and median values, and error bars indicate the 5th and 95th percent confidence intervals for controls. WAS patients are identified by filled symbols.
Figure 12
Figure 12
Complementarity determining region 3 length analysis of IGHV subgroups. CDR3 length analysis was performed on CD19+ cells expressing IGHV1-18 (A), IGHV5 (B), or IGHV3-66 (C). The mean distribution of controls (C1 and C2) is displayed as a blue bar. A double bar indicates the value of the bar has exceeded the axis limit, and the maximum value is indicated within brackets.
Figure 13
Figure 13
Usage of IGHC genes in unique IGH sequences from WAS patients and controls. Usage of IGHC families is displayed as the percentage of the total number of unique clonotypes for both control (blue dots) and WAS patients (red squares). Results are shown for all isotypes and for individual isotypes. Bars indicate the mean and SE.
Figure 14
Figure 14
Analysis of somatic hypermutation. The rate (per 1,000 nucleotides) of somatic hypermutation in complementarity determining regions (CDR) and framework regions (FR) is shown for controls and WAS patients. Bars indicate the mean ± SD.

Similar articles

Cited by

References

    1. Wiskott A. Familiarer, angeborener Morbus Werlhofii? Monatsschr Kinderheilkd (1937) 68:212–6
    1. Aldrich RA, Steinberg AG, Campbell DC. Pedigree demonstrating a sex-linked recessive condition characterized by draining ears, eczematoid dermatitis and bloody diarrhea. Pediatrics (1954) 13:133–9 - PubMed
    1. Sullivan KE, Mullen CA, Blaese RM, Winkelstein JA. A multiinstitutional survey of the Wiskott-Aldrich syndrome. J Pediatr (1994) 125:876–8510.1016/S0022-3476(05)82002-5 - DOI - PubMed
    1. Mahlaoui N, Pellier I, Mignot C, Jais JP, Bilhou-Nabera C, Moshous D, et al. Characteristics and outcome of early-onset, severe forms of Wiskott-Aldrich syndrome. Blood (2013) 121:1510–610.1182/blood-2012-08-448118 - DOI - PubMed
    1. Derry JM, Ochs HD, Francke U. Isolation of a novel gene mutated in Wiskott-Aldrich syndrome. Cell (1994) 78:635–4410.1016/0092-8674(94)90528-2 - DOI - PubMed