

Nitrate dynamics in natural plants: insights based on the concentration and natural isotope abundances of tissue nitrate
- PMID: 25101106
- PMCID: PMC4108036
- DOI: 10.3389/fpls.2014.00355
Nitrate dynamics in natural plants: insights based on the concentration and natural isotope abundances of tissue nitrate
Abstract
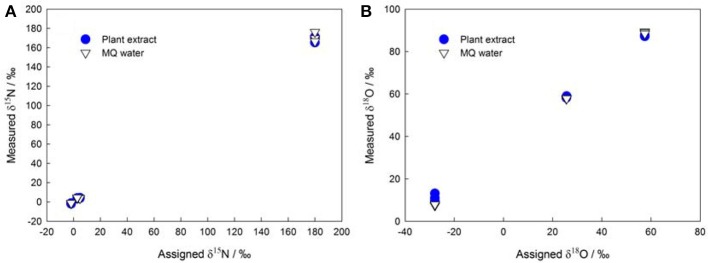
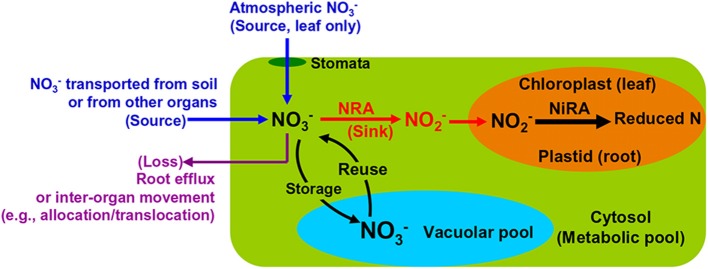
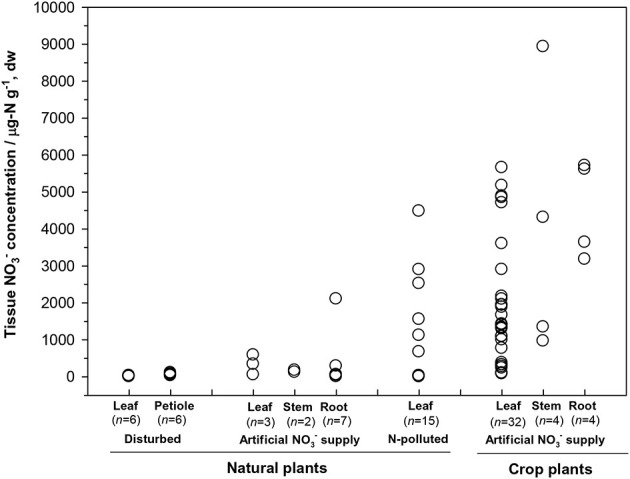
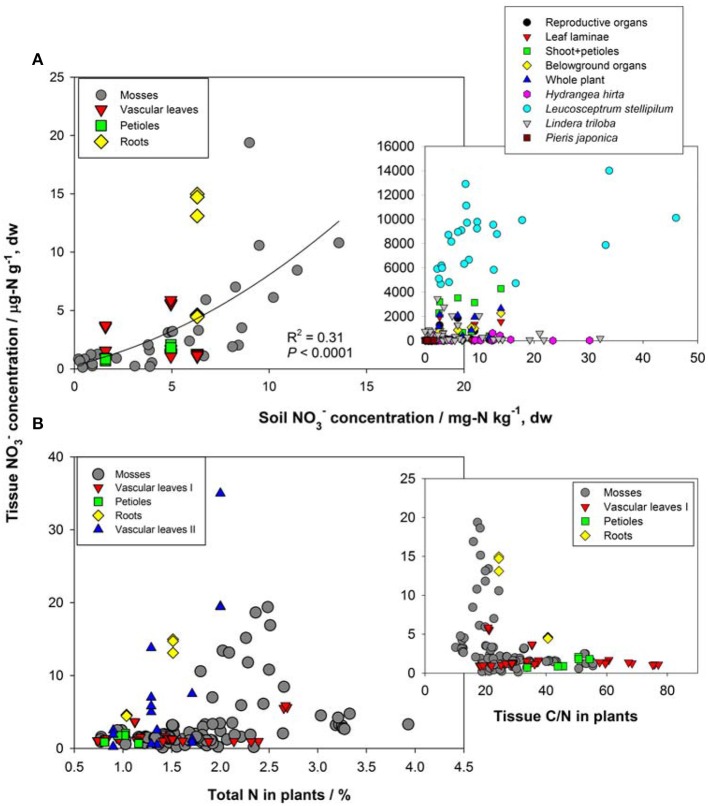
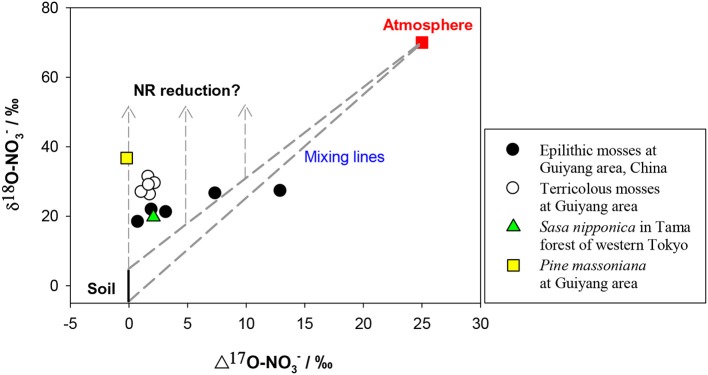
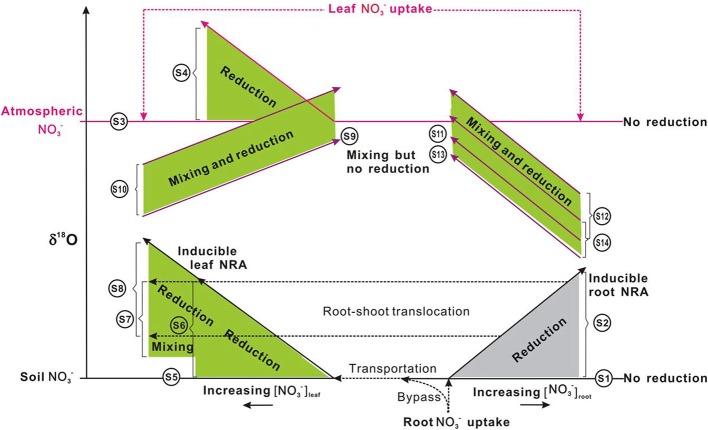
The dynamics of nitrate (NO(-) 3), a major nitrogen (N) source for natural plants, has been studied mostly through experimental N addition, enzymatic assay, isotope labeling, and genetic expression. However, artificial N supply may not reasonably reflect the N strategies in natural plants because NO(-) 3 uptake and reduction may vary with external N availability. Due to abrupt application and short operation time, field N addition, and isotopic labeling hinder the elucidation of in situ NO(-) 3-use mechanisms. The concentration and natural isotopes of tissue NO(-) 3 can offer insights into the plant NO(-) 3 sources and dynamics in a natural context. Furthermore, they facilitate the exploration of plant NO(-) 3 utilization and its interaction with N pollution and ecosystem N cycles without disturbing the N pools. The present study was conducted to review the application of the denitrifier method for concentration and isotope analyses of NO(-) 3 in plants. Moreover, this study highlights the utility and advantages of these parameters in interpreting NO(-) 3 sources and dynamics in natural plants. We summarize the major sources and reduction processes of NO(-) 3 in plants, and discuss the implications of NO(-) 3 concentration in plant tissues based on existing data. Particular emphasis was laid on the regulation of soil NO(-) 3 and plant ecophysiological functions in interspecific and intra-plant NO(-) 3 variations. We introduce N and O isotope systematics of NO(-) 3 in plants and discuss the principles and feasibilities of using isotopic enrichment and fractionation factors; the correlation between concentration and isotopes (N and O isotopes: δ(18)O and Δ(17)O); and isotope mass-balance calculations to constrain sources and reduction of NO(-) 3 in possible scenarios for natural plants are deliberated. Finally, we offer a preliminary framework of intraplant δ(18)O-NO(-) 3 variation, and summarize the uncertainties in using tissue NO(-) 3 parameters to interpret plant NO(-) 3 utilization.
Keywords: atmospheric nitrate; denitrifier method; isotopic enrichment; isotopic fractionation; nitrate reductase; oxygen isotope; plant nitrate; soil nitrogen availability.
Figures
Similar articles
-
A stable isotope approach and its application for identifying nitrate source and transformation process in water.Environ Sci Pollut Res Int. 2016 Jan;23(2):1133-48. doi: 10.1007/s11356-015-5309-6. Epub 2015 Nov 6. Environ Sci Pollut Res Int. 2016. PMID: 26541149
-
Tansley Review No. 95 15 N natural abundance in soil-plant systems.New Phytol. 1997 Oct;137(2):179-203. doi: 10.1046/j.1469-8137.1997.00808.x. New Phytol. 1997. PMID: 33863175
-
Interpretation of nitrogen isotope signatures using the NIFTE model.Oecologia. 1999 Aug;120(3):405-415. doi: 10.1007/s004420050873. Oecologia. 1999. PMID: 28308017
-
Unignorable enzyme-specific isotope fractionation for nitrate source identification in aquatic ecosystem.Chemosphere. 2024 Jan;348:140771. doi: 10.1016/j.chemosphere.2023.140771. Epub 2023 Nov 22. Chemosphere. 2024. PMID: 38000558 Review.
-
Research Advances in the Analysis of Nitrate Pollution Sources in a Freshwater Environment Using δ15N-NO3- and δ18O-NO3.Int J Environ Res Public Health. 2021 Nov 11;18(22):11805. doi: 10.3390/ijerph182211805. Int J Environ Res Public Health. 2021. PMID: 34831560 Free PMC article. Review.
Cited by
-
Computer-Based Tools Unmask Critical Mineral Nutrient Interactions in Hoagland Solution for Healthy Kiwiberry Plant Acclimatization.Front Plant Sci. 2021 Oct 28;12:723992. doi: 10.3389/fpls.2021.723992. eCollection 2021. Front Plant Sci. 2021. PMID: 34777411 Free PMC article.
-
Partial substitution of nitrate by chloride in fertigation recipes allows for lower nitrate input in hydroponic lettuce crops.Front Plant Sci. 2024 Jul 23;15:1411572. doi: 10.3389/fpls.2024.1411572. eCollection 2024. Front Plant Sci. 2024. PMID: 39114473 Free PMC article.
-
Transcriptome Analysis and Intraspecific Variation in Spanish Fir (Abies pinsapo Boiss.).Int J Mol Sci. 2022 Aug 19;23(16):9351. doi: 10.3390/ijms23169351. Int J Mol Sci. 2022. PMID: 36012612 Free PMC article.
-
Nitrate is an important nitrogen source for Arctic tundra plants.Proc Natl Acad Sci U S A. 2018 Mar 27;115(13):3398-3403. doi: 10.1073/pnas.1715382115. Epub 2018 Mar 14. Proc Natl Acad Sci U S A. 2018. PMID: 29540568 Free PMC article.
-
Differential contributions of NO3 -/NH4 + to nitrogen use in response to a variable inorganic nitrogen supply in plantlets of two Brassicaceae species in vitro.Plant Methods. 2019 Jul 31;15:86. doi: 10.1186/s13007-019-0473-1. eCollection 2019. Plant Methods. 2019. PMID: 31384291 Free PMC article.
References
-
- Aber J., McDowell W., Nadelhoffer K., Magill A., Berntson G., Kamakea M., et al. (1998). Nitrogen saturation in temperate forest ecosystems: hypotheses revisited. Bioscience 48, 921–934 10.2307/1313296 - DOI
-
- Altieri K., Hastings M., Gobel A., Peters A., Sigman D. (2013). Isotopic composition of rainwater nitrate at Bermuda: the influence of air mass source and chemistry in the marine boundary layer. J. Geophys. Res. Atmos. 118, 304–311 10.1002/jgrd.50829 - DOI
-
- Alves B. J. R., Zotarelli L., Resende A. S., Polidoro J. C., Urquiaga S., Boddey R. M. (2000). Rapid and sensitive determination of nitrate in plant tissue using flow injection analysis. Commun. Soil Sci. Plant Anal. 31, 2739–2750 10.1080/00103620009370623 - DOI
-
- Amberger A., Schmidt H.-L. (1987). Natiirliche Isotopengehalte yon Nitrat als Indikatoren fiir dessen Herkunft. Geochim. Cosmochim. Acta. 51, 2699–2705 10.1016/0016-7037(87)90150-5 - DOI
Publication types
LinkOut - more resources
Full Text Sources
Other Literature Sources