

Limitations of the dorsal skinfold window chamber model in evaluating anti-angiogenic therapy during early phase of angiogenesis
- PMID: 25101168
- PMCID: PMC4123308
- DOI: 10.1186/2045-824X-6-17
Limitations of the dorsal skinfold window chamber model in evaluating anti-angiogenic therapy during early phase of angiogenesis
Abstract
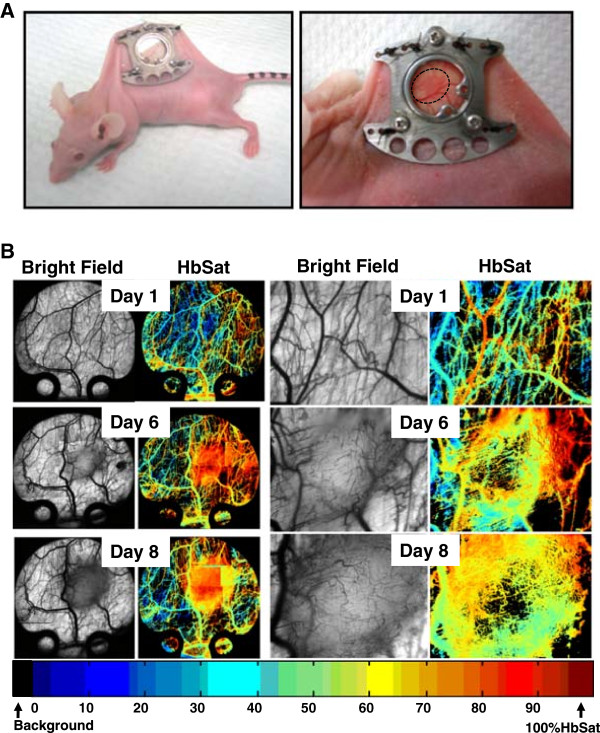
Background: Angiogenesis is an essential process during tumor development and growth. The murine dorsal skinfold window chamber model has been used for the study of both tumor microvasculature and other vascular diseases, including the study of anti-angiogenic agents in cancer therapy. Hyperspectral imaging of oxygen status of the microvasculature has not been widely used to evaluate response to inhibition of angiogenesis in early tumor cell induced vascular development. This study demonstrates the use of two different classes of anti-angiogenic agents, one targeting the Vascular Endothelial Growth Factor (VEGF) pathway involved with vessel sprouting and the other targeting the Angiopoietin/Tie2 pathway involved in vascular destabilization. Studies evaluated the tumor microvascular response to anti-angiogenic inhibitors in the highly angiogenic renal cell carcinoma induced angiogenesis model.
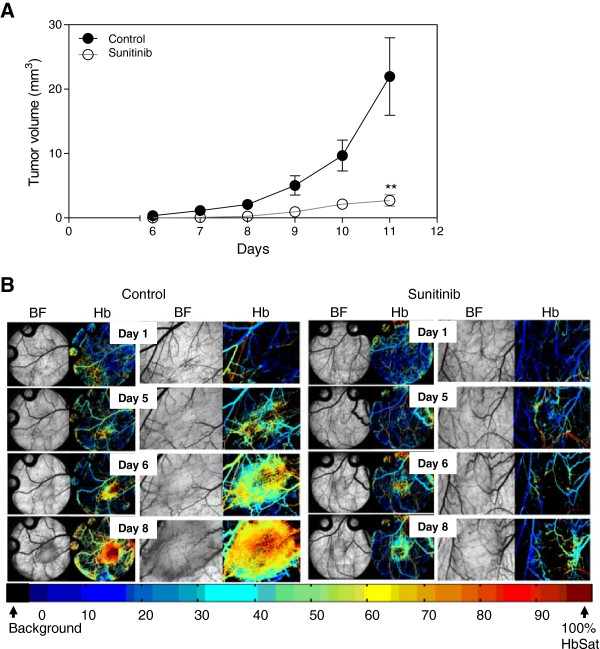
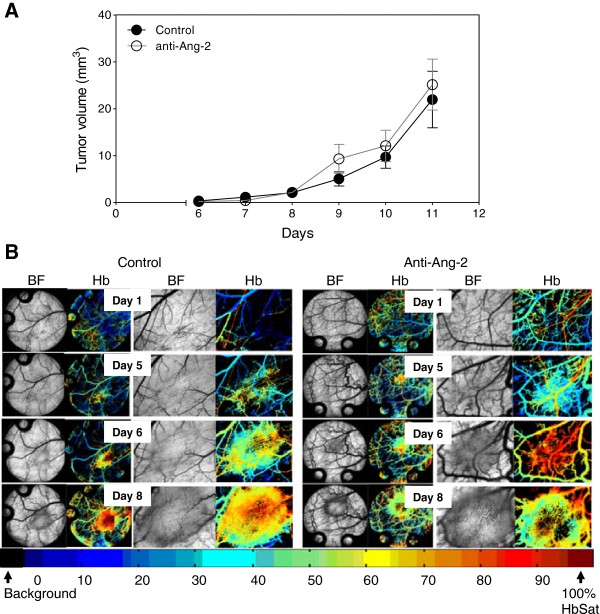
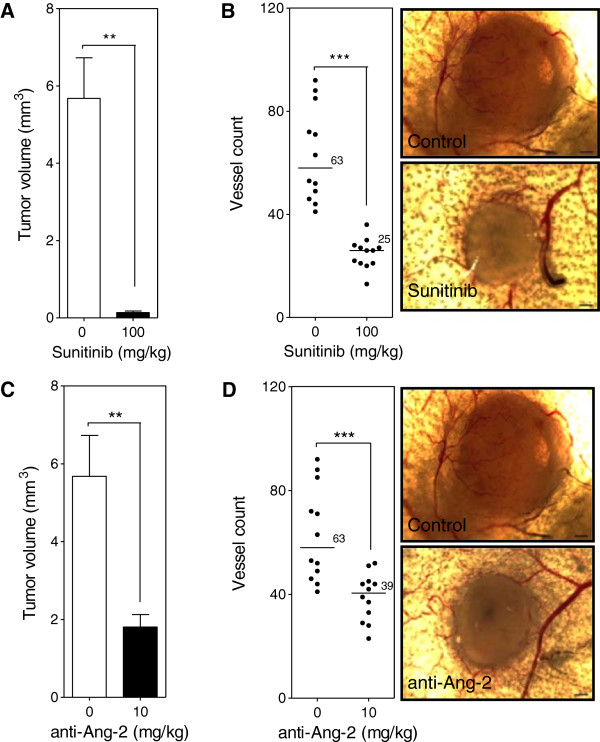
Methods: Human renal cell carcinoma, Caki-2 cells, were implanted in the murine skinfold window chamber. Mice were treated with either VEGF pathway targeted small molecule inhibitor Sunitinib (100 mg/kg) or with an anti-Ang-2 monoclonal antibody (10 mg/kg) beginning the day of window chamber surgery and tumor cell implantation. Hyperspectral imaging of hemoglobin saturation was used to evaluate both the development and oxygenation of the tumor microvasculature. Tumor volume over time was also assessed over an 11-day period post surgery.
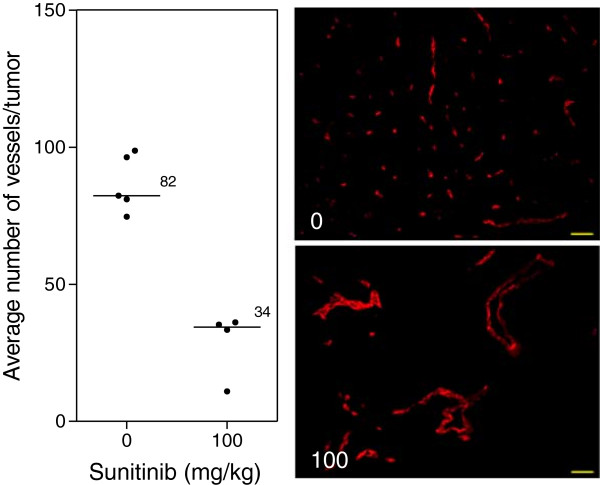
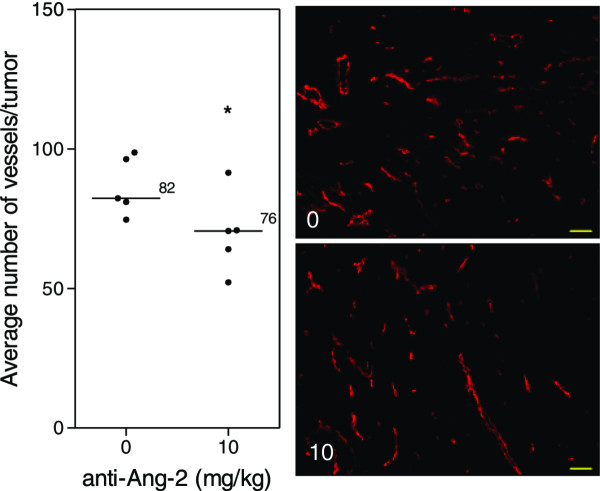
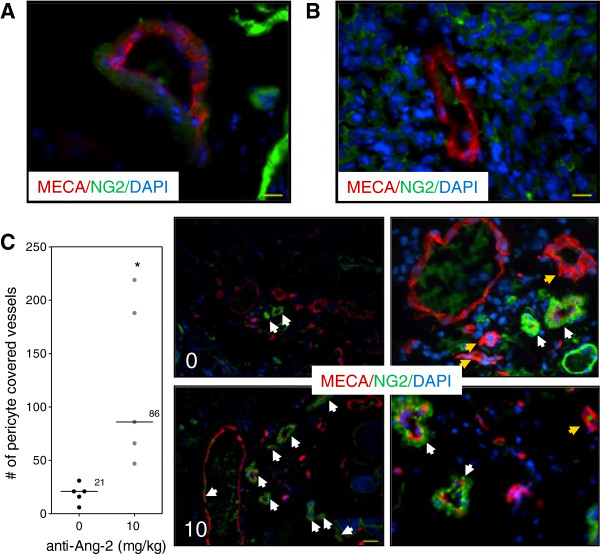
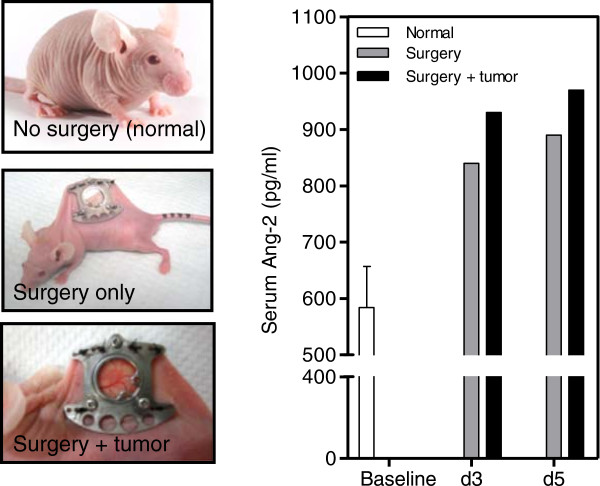
Results: The window chamber model was useful to demonstrate the inhibition of angiogenesis using the VEGF pathway targeted agent Sunitinib. Results show impairment of tumor microvascular development, reduced oxygenation of tumor-associated vasculature and impairment of tumor volume growth compared to control. On the other hand, this model failed to demonstrate the anti-angiogenic effect of the Ang-2 targeted agent. Follow up experiments suggest that the initial surgery of the window chamber model may interfere with such an agent thus skewing the actual effects on angiogenesis.
Conclusions: Results show that this model has great potential to evaluate anti-VEGF, or comparable, targeted agents; however the mere protocol of the window chamber model interferes with proper evaluation of Ang-2 targeted agents. The limitations of this in vivo model in evaluating the response of tumor vasculature to anti-angiogenic agents are discussed.
Keywords: Angiogenesis; Angiopoietin-2; Anti-angiogenic therapy; Dorsal skinfold window chamber model; Vascular endothelial growth factor.
Figures
Similar articles
-
Inhibition of endothelial/smooth muscle cell contact loss by the investigational angiopoietin-2 antibody MEDI3617.Microvasc Res. 2012 May;83(3):290-7. doi: 10.1016/j.mvr.2012.02.008. Epub 2012 Feb 23. Microvasc Res. 2012. PMID: 22387475 Free PMC article.
-
Quantitation and physiological characterization of angiogenic vessels in mice: effect of basic fibroblast growth factor, vascular endothelial growth factor/vascular permeability factor, and host microenvironment.Am J Pathol. 1996 Jul;149(1):59-71. Am J Pathol. 1996. PMID: 8686763 Free PMC article.
-
VEGFR2-Targeted Contrast-Enhanced Ultrasound to Distinguish between Two Anti-Angiogenic Treatments.Ultrasound Med Biol. 2015 Aug;41(8):2202-11. doi: 10.1016/j.ultrasmedbio.2015.04.010. Epub 2015 May 15. Ultrasound Med Biol. 2015. PMID: 25980323
-
Targeting tumor micro-environment for design and development of novel anti-angiogenic agents arresting tumor growth.Prog Biophys Mol Biol. 2013 Nov;113(2):333-54. doi: 10.1016/j.pbiomolbio.2013.10.001. Epub 2013 Oct 15. Prog Biophys Mol Biol. 2013. PMID: 24139944 Review.
-
Angiopoietin inhibitors: A review on targeting tumor angiogenesis.Eur J Pharmacol. 2021 May 15;899:174021. doi: 10.1016/j.ejphar.2021.174021. Epub 2021 Mar 16. Eur J Pharmacol. 2021. PMID: 33741382 Review.
Cited by
-
Monitoring the primo vascular system in lymphatic vessels by using window chambers.Biomed Opt Express. 2016 Mar 14;7(4):1251-9. doi: 10.1364/BOE.7.001251. eCollection 2016 Apr 1. Biomed Opt Express. 2016. PMID: 27446651 Free PMC article.
-
Vascular patterning of subcutaneous mouse fibrosarcomas expressing individual VEGF isoforms can be differentiated using angiographic optical coherence tomography.Biomed Opt Express. 2017 Sep 19;8(10):4551-4567. doi: 10.1364/BOE.8.004551. eCollection 2017 Oct 1. Biomed Opt Express. 2017. PMID: 29082084 Free PMC article.
-
Monitoring of tumor growth and vascularization with repetitive ultrasonography in the chicken chorioallantoic-membrane-assay.Sci Rep. 2020 Oct 29;10(1):18585. doi: 10.1038/s41598-020-75660-y. Sci Rep. 2020. PMID: 33122780 Free PMC article.
-
Intravital Imaging of Adoptive T-Cell Morphology, Mobility and Trafficking Following Immune Checkpoint Inhibition in a Mouse Melanoma Model.Front Immunol. 2020 Jul 22;11:1514. doi: 10.3389/fimmu.2020.01514. eCollection 2020. Front Immunol. 2020. PMID: 32793206 Free PMC article.
-
Understanding the in vivo Fate of Advanced Materials by Imaging.Adv Funct Mater. 2020 Sep 10;30(37):1910369. doi: 10.1002/adfm.201910369. Epub 2020 Apr 6. Adv Funct Mater. 2020. PMID: 38545084 Free PMC article.
References
LinkOut - more resources
Full Text Sources
Other Literature Sources
Miscellaneous
