

Analysis of the Dielectric constant of saline-alkali soils and the effect on radar backscattering coefficient: a case study of soda alkaline saline soils in Western Jilin Province using RADARSAT-2 data
- PMID: 25101317
- PMCID: PMC4102067
- DOI: 10.1155/2014/563015
Analysis of the Dielectric constant of saline-alkali soils and the effect on radar backscattering coefficient: a case study of soda alkaline saline soils in Western Jilin Province using RADARSAT-2 data
Abstract
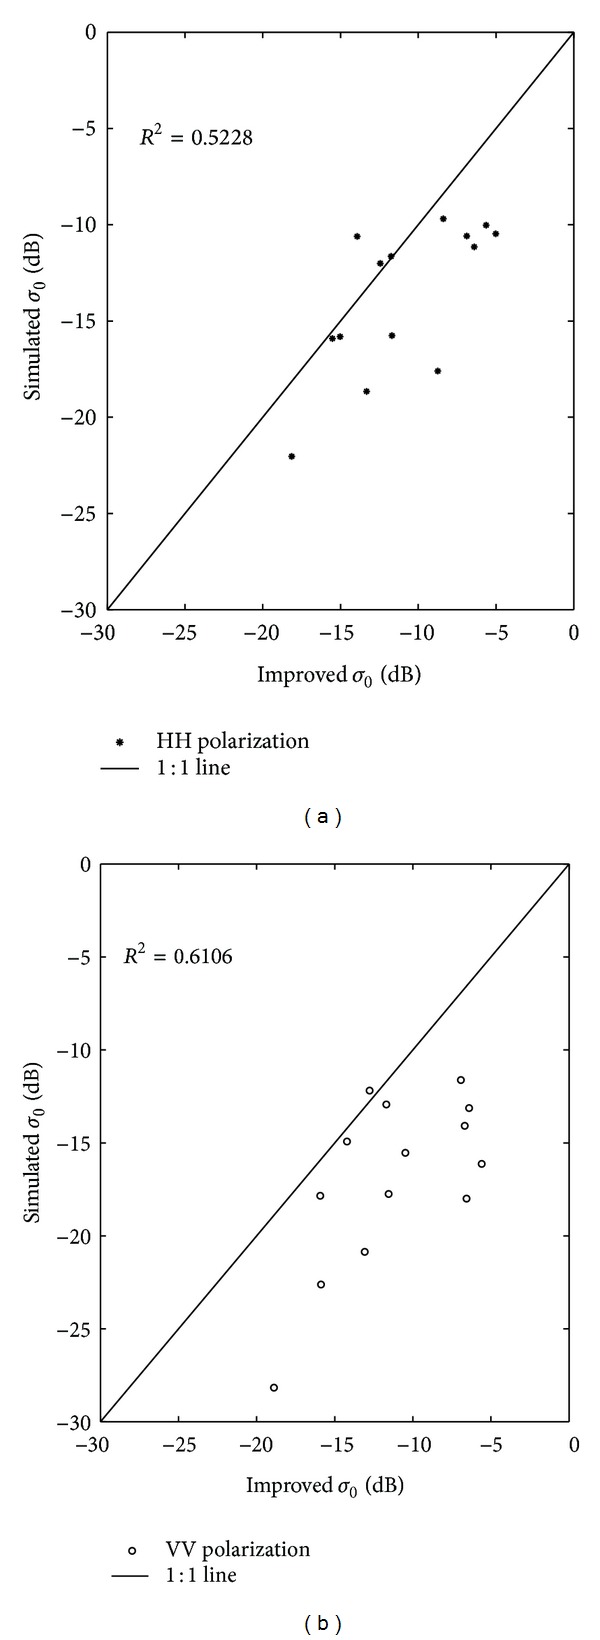
Soil salinity is a global problem, especially in developing countries, which affects the environment and productivity of agriculture areas. Salt has a significant effect on the complex dielectric constant of wet soil. However, there is no suitable model to describe the variation in the backscattering coefficient due to changes in soil salinity content. The purpose of this paper is to use backscattering models to understand behaviors of the backscattering coefficient in saline soils based on the analysis of its dielectric constant. The effects of moisture and salinity on the dielectric constant by combined Dobson mixing model and seawater dielectric constant model are analyzed, and the backscattering coefficient is then simulated using the AIEM. Simultaneously, laboratory measurements were performed on ground samples. The frequency effect of the laboratory results was not the same as the simulated results. The frequency dependence of the ionic conductivity of an electrolyte solution is influenced by the ion's components. Finally, the simulated backscattering coefficients measured from the dielectric constant with the AIEM were analyzed using the extracted backscattering coefficient from the RADARSAT-2 image. The results show that RADARSAT-2 is potentially able to measure soil salinity; however, the mixed pixel problem needs to be more thoroughly considered.
Figures


References
-
- FAO. Land Resource Potential and Constraints Statistics at Country and Regional Level. Food and Agriculture Organization; 2010.
-
- Ulaby FT. Radar measurement of soil moisture content. IEEE Transactions on Antennas and Propagation. 1974;22(2):257–265.
-
- Fung AK, Li Z, Chen KS. Backscattering from a randomly rough dielectric surface. IEEE Transactions on Geoscience and Remote Sensing. 1992;30(2):356–369.
-
- Engman ET, Chauhan N. Status of microwave soil moisture measurements with remote sensing. Remote Sensing of Environment. 1995;51(1):189–198.
-
- Dubois PC, van Zyl J, Engman T. Measuring soil moisture with imaging radars. IEEE Transactions on Geoscience and Remote Sensing. 1995;33(4):915–926.
MeSH terms
Substances
LinkOut - more resources
Full Text Sources
Other Literature Sources
