Electrogram morphology recurrence patterns during atrial fibrillation
- PMID: 25101485
- PMCID: PMC4252253
- DOI: 10.1016/j.hrthm.2014.08.002
Electrogram morphology recurrence patterns during atrial fibrillation
Abstract
Background: Traditional mapping of atrial fibrillation (AF) is limited by changing electrogram morphologies and variable cycle lengths.
Objective: We tested the hypothesis that morphology recurrence plot analysis would identify sites of stable and repeatable electrogram morphology patterns.
Methods: AF electrograms recorded from left atrial (LA) and right atrial (RA) sites in 19 patients (10 men; mean age 59 ± 10 years) before AF ablation were analyzed. Morphology recurrence plots for each electrogram recording were created by cross-correlation of each automatically detected activation with every other activation in the recording. A recurrence percentage, the percentage of the most common morphology, and the mean cycle length of activations with the most recurrent morphology were computed.
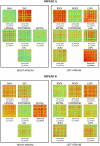
Results: The morphology recurrence plots commonly showed checkerboard patterns of alternating high and low cross-correlation values, indicating periodic recurrences in morphologies. The mean recurrence percentage for all sites and all patients was 38 ± 25%. The highest recurrence percentage per patient averaged 83 ± 17%. The highest recurrence percentage was located in the RA in 5 patients and in the LA in 14 patients. Patients with sites of shortest mean cycle length of activations with the most recurrent morphology in the LA and RA had ablation failure rates of 25% and 100%, respectively (hazard ratio 4.95; P = .05).
Conclusion: A new technique to characterize electrogram morphology recurrence demonstrated that there is a distribution of sites with high and low repeatability of electrogram morphologies. Sites with rapid activation of highly repetitive morphology patterns may be critical to sustaining AF. Further testing of this approach to map and ablate AF sources is warranted.
Keywords: Atrial fibrillation; Electrograms; Mapping; Signal processing.
Copyright © 2014 Heart Rhythm Society. Published by Elsevier Inc. All rights reserved.
Figures


Similar articles
-
Electrogram Morphology Recurrence for Mapping Persistent Atrial Fibrillation: Initial vs Redo Catheter Ablation.JACC Clin Electrophysiol. 2023 Apr;9(4):526-540. doi: 10.1016/j.jacep.2022.11.003. Epub 2023 Jan 18. JACC Clin Electrophysiol. 2023. PMID: 36669899 Free PMC article.
-
Searching for "order" in atrial fibrillation using electrogram morphology recurrence plots.Comput Biol Med. 2015 Oct 1;65:220-8. doi: 10.1016/j.compbiomed.2015.07.018. Epub 2015 Jul 29. Comput Biol Med. 2015. PMID: 26255963
-
Electrogram morphology recurrence guided catheter ablation for repeat ablation of persistent atrial fibrillation.J Interv Card Electrophysiol. 2024 Jan;67(1):183-191. doi: 10.1007/s10840-023-01594-w. Epub 2023 Jul 3. J Interv Card Electrophysiol. 2024. PMID: 37395978 Free PMC article.
-
Catheter ablation of atrial fibrillation guided by complex fractionated atrial electrogram mapping of atrial fibrillation substrate.J Cardiol. 2010 Jan;55(1):1-12. doi: 10.1016/j.jjcc.2009.11.002. Epub 2009 Dec 16. J Cardiol. 2010. PMID: 20122543 Review.
-
Catheter ablation of atrial fibrillation guided by electrogram fractionation and dominant frequency analysis.Expert Rev Cardiovasc Ther. 2011 May;9(5):631-6. doi: 10.1586/erc.11.36. Expert Rev Cardiovasc Ther. 2011. PMID: 21615326 Review.
Cited by
-
An Evaluation of Phase Analysis to Interpret Atrial Activation Patterns during Persistent Atrial Fibrillation for Targeted Ablation.J Clin Med. 2022 Sep 30;11(19):5807. doi: 10.3390/jcm11195807. J Clin Med. 2022. PMID: 36233675 Free PMC article.
-
Mechanistic targets for the ablation of atrial fibrillation.Glob Cardiol Sci Pract. 2017 Mar 31;2017(1):e201707. doi: 10.21542/gcsp.2017.7. Glob Cardiol Sci Pract. 2017. PMID: 28971106 Free PMC article. Review.
-
Atrial electrogram discordance during baseline vs reinduced atrial fibrillation: Potential ramifications for ablation procedures.Heart Rhythm. 2015 Jul;12(7):1448-55. doi: 10.1016/j.hrthm.2015.03.044. Epub 2015 Mar 26. Heart Rhythm. 2015. PMID: 25818256 Free PMC article.
-
Stationary Atrial Fibrillation Properties in the Goat Do Not Entail Stable or Recurrent Conduction Patterns.Front Physiol. 2018 Jul 27;9:947. doi: 10.3389/fphys.2018.00947. eCollection 2018. Front Physiol. 2018. PMID: 30100877 Free PMC article.
-
Regions of Highly Recurrent Electrogram Morphology With Low Cycle Length Reflect Substrate for Atrial Fibrillation.JACC Basic Transl Sci. 2022 Nov 23;8(1):68-84. doi: 10.1016/j.jacbts.2022.07.011. eCollection 2023 Jan. JACC Basic Transl Sci. 2022. PMID: 36777167 Free PMC article.
References
-
- Jaïs P, Haïssaguerre M, Shah DC, Chouairi S, Gencel L, Hocini M, Clémenty J. A focal source of atrial fibrillation treated by discrete radiofrequency ablation. Circulation. 1997;95:572–576. - PubMed
-
- Holm M, Johansson R, Brandt J, Lührs C, Olsson SB. Epicardial right atrial free wall mapping in chronic atrial fibrillation. Documentation of repetitive activation with a focal spread--a hitherto unrecognised phenomenon in man. Eur Heart J. 1997;18:290–310. - PubMed
-
- Allessie MA, Bonke FIM, Schopman FJC. Circus movement in rabbit atrial muscle as a mechanism of tachycardia. Iii. The “leading circle” concept. A new model of circus movement in cardiac tissue without the involvement of an anatomical obstacle. Circ Res. 1977;41:9–41. - PubMed
-
- Konings KT, Kirchhof CJ, Smeets JR, Wellens HJ, Penn OC, Allessie MA. High-density mapping of electrically induced atrial fibrillation in humans. Circulation. 1994;89:1665–1680. - PubMed
-
- Moe GK. On the multiple wavelet hypothesis of atrial fibrillation. Arch Int Pharmacodyn Ther. 1962;140:183–188.
Publication types
MeSH terms
Grants and funding
LinkOut - more resources
Full Text Sources
Other Literature Sources
Medical

