. 2014 Aug 7;10(8):e1004504.
doi: 10.1371/journal.pgen.1004504. eCollection 2014 Aug.

Evidence for divisome localization mechanisms independent of the Min system and SlmA in Escherichia coli

Affiliations

Evidence for divisome localization mechanisms independent of the Min system and SlmA in Escherichia coli

Matthew W Bailey et al. PLoS Genet. .

Abstract

Cell division in Escherichia coli starts with assembly of FtsZ protofilaments into a ring-like structure, the Z-ring. Positioning of the Z-ring at midcell is thought to be coordinated by two regulatory systems, nucleoid occlusion and the Min system. In E. coli, nucleoid occlusion is mediated by the SlmA proteins. Here, we address the question of whether there are additional positioning systems that are capable of localizing the E. coli divisome with respect to the cell center. Using quantitative fluorescence imaging we show that slow growing cells lacking functional Min and SlmA nucleoid occlusion systems continue to divide preferentially at midcell. We find that the initial Z-ring assembly occurs over the center of the nucleoid instead of nucleoid-free regions under these conditions. We determine that Z-ring formation begins shortly after the arrival of the Ter macrodomain at the nucleoid center. Removal of either the MatP, ZapB, or ZapA proteins significantly affects the accuracy and precision of Z-ring positioning relative to the nucleoid center in these cells in accordance with the idea that these proteins link the Ter macrodomain and the Z-ring. Interestingly, even in the absence of Min, SlmA, and the putative Ter macrodomain - Z-ring link, there remains a weak midcell positioning bias for the Z-ring. Our work demonstrates that additional Z-ring localization systems are present in E. coli than are known currently. In particular, we identify that the Ter macrodomain acts as a landmark for the Z-ring in the presence of MatP, ZapB and ZapA proteins.


Conflict of interest statement

The authors have declared that no competing interests exist.

Figures

Figure 1
Figure 1. Relative volume fractions of daughter cells after division.
(A) Wild type (BW25113), (B) ΔminC (JW1165), (C) ΔslmA ΔminC (PB194) strains. Volume fractions are calculated as the ratio of one daughter cell's volume to the sum of both daughters' volumes. Red dashed lines in the histogram show fittings of different peaks with a Gaussian function. The centers of fitting lines are fixed to 1/4, 1/3, 1/2, 2/3 and 3/4 values. The insets in the histograms show fluorescent images of cells from the respective strains. The arrow in the inset of panel (B) points to a minicelling division. All scale bars correspond to 2 µm.
Figure 2
Figure 2. Division frequency at the 1/4 and 1/2 cell positions with respect to mother cell length.
(A) Data for the ΔslmA ΔminC double mutant strain (PB194); (B) ΔminC strain (JW1165). Cell lengths are binned at 0.25 µm intervals. Arrows point to transition regions from centrally occurring divisions to divisions at cell quarters. The lengths of the mother cells are measured just before cell division. Note that only a few cells from both strains are longer than 8 µm, limiting analysis for longer cells.
Figure 3
Figure 3. Localization of ZipA-GFP labeled Z-rings relative to cell center and the center of nucleoids.
(A) A composite of ZipA-GFP (green), DAPI stained nucleoid (red) and phase contrast images (grey) of a ΔslmA Δmin cell with a distinctly off-center placed nucleoid. The scale bar is 2 µm. (B) The intensity line profiles of each image plane along the long axis of the cell for the cell shown in panel A. The displacement of the nucleoid relative to the cell center is ΔXn, and the displacement of the ZipA-GFP labeled Z-ring is ΔXz. (C) ΔXz vs. ΔXn for ΔslmA Δmin cells (strain TB86) scaled by cell length L. Solid rectangles mark central and open rectangles mark polar Z-rings. The solid line corresponds to formula image
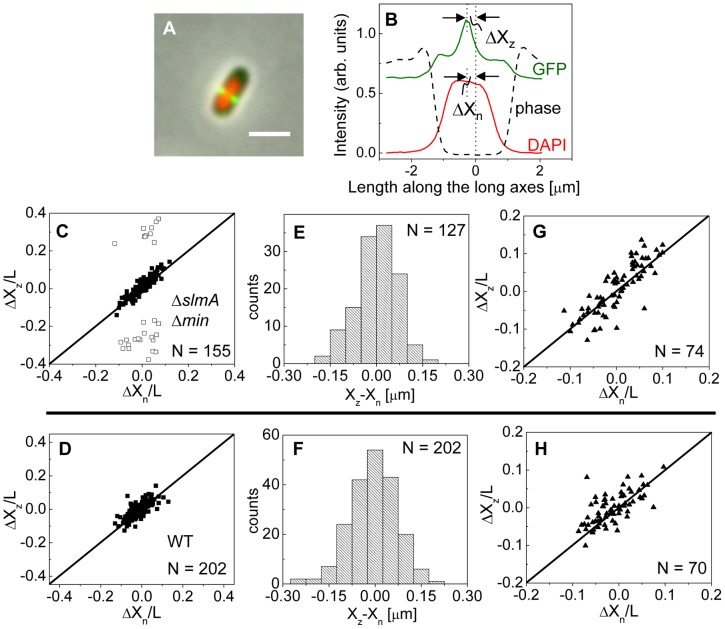
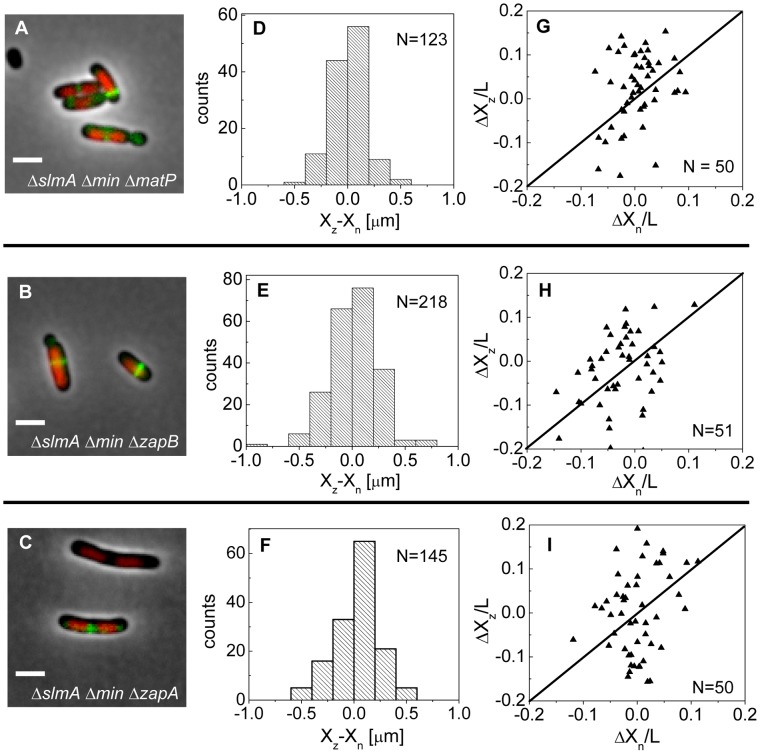
. Data are shown only for cells with a single nucleoid. (D) ΔXz vs. ΔXn for the parental strain (strain JMBW5). (E), (F) Distribution of distances between the Z-ring center and nucleoid center for ΔslmA Δmin strain and parental strain, respectively. Data for central Z-rings are shown. (G), (H) ΔXz vs. ΔXn for cells that show a Z-ring over a compact nucleoid in ΔslmA Δmin and in parental strain, respectively.
Figure 4
Figure 4. Positioning of Z-rings relative to nucleoids in multi-nucleoid cells.
(A) A composite image of longer ΔslmA Δmin cell. ZipA-GFP (green), DAPI stained nucleoid (red), and phase contrast images (grey) have been overlaid. Scale bar is 2 µm. (B) Nucleoid and ZipA-GFP density distributions along the long axis of the cell for the cell shown in panel (A). The positions marked by “N” correspond to the new division sites at the centers of the nucleoids and the position marked by “O” to old division site between fully segregated nucleoids. (C) Frequency of Z-rings in the double mutant cells at the new and old replication sites. Only cells that have two or more distinct nucleoids have been analyzed. Error bars represent standard deviations over three independent measurements each involving about 50 cells. (D)–(F) the same for wild type cells that have been treated for 2 hours with 20 µg/ml cephalexin.
Figure 5
Figure 5. Positioning of the Z-ring relative to the MatP-labeled Ter macrodomain.
(A) A composite of ZipA-GFP (green), MatP-mCherry (red), and phase contrast image (grey) of ΔslmA Δmin cells (strain WD1). Scale bar is 2 µm. (B) The same for the wild type strain (strain WD2). (C) Location of ZipA-GFP labeled Z-ring (ΔXz) vs location of MatP-mCherry focus (ΔXMatP) in ΔslmA Δmin cells scaled by the cell length L. Both locations are referenced relative to the cell center. Solid symbols correspond to locations near the center of the nucleoid and open squares to locations near the poles. The straight line corresponds to formula image
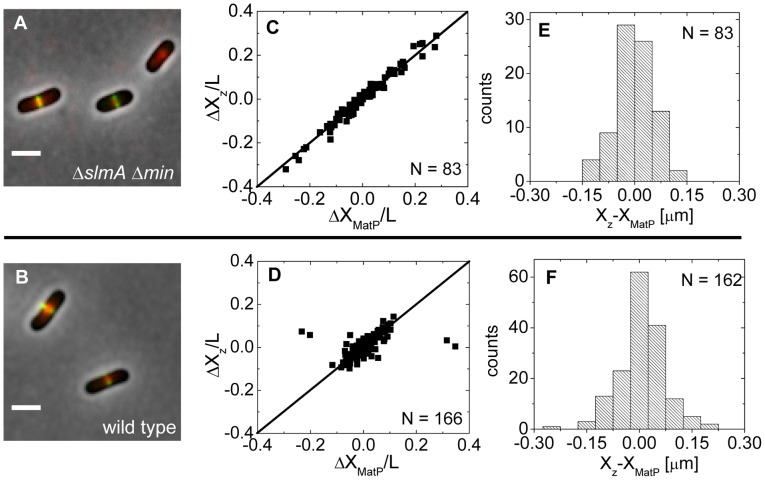
. Only cells with a single MatP focus are analyzed. (D) ΔXz vs ΔXMatP for wild type cells. (E), (F) Distribution of distances between the Z-ring and the MatP focus along the long axes of the cell for ΔslmA Δmin and wild type cells, respectively.
Figure 6
Figure 6. Arrival of the MatP foci and the Z-ring at midcell.
(A) Distribution of ZipA-GFP along the cell length as a function of time for a short ΔslmA Δmin cell (strain WD1). (B) Distribution of MatP-mCherry labeled Ter region for the same cell. In the heat maps blue corresponds to low and red to high intensity. The dashed black line approximately marks midcell. (C) Histogram of time differences between the arrival of MatP (tMatP) and ZipA (tz) at midcell. The times are expressed in doubling times. (D) Accumulation of ZipA-GFP (blue triangles) and MatP-mCherry (red rectangles) at midcell as a function of time. Each curve represents the average from measurements of 15 cells. Error bars represent standard errors. (E) Distribution of ZipA-GFP and (F) MatP-mCherry in a long ΔslmA Δmin cell.
Figure 7
Figure 7. Positioning of the Z-rings relative to the cell and nucleoid centers in triple deletion strains.
Composite of DAPI labelled nucleoid (red), ZipA-GFP (green) and phase contrast image in (A) ΔslmA Δmin ΔmatP, (B) ΔslmA Δmin ΔzapB, and (C) ΔslmA Δmin ΔzapA cells. Scale bar is 2 µm. (D)–(F) Distribution of distances between the Z-ring center and nucleoid center for ΔslmA Δmin ΔmatP, ΔslmA Δmin ΔzapB, and ΔslmA Δmin ΔzapA cells, respectively. (G)–(I) ΔXz vs. ΔXn in ΔslmA Δmin ΔmatP, ΔslmA Δmin ΔzapB, and ΔslmA Δmin ΔzapA cells, respectively. Data are from cells with a single compact nucleoid and a central Z-ring. Straight lines correspond to formula image.

Similar articles

Cited by

References

    1. Bi E, Lutkenhaus J (1991) FtsZ ring structure associated with division in Escherichia coli . Nature 354: 161–164. - PubMed
    1. Margolin W (2005) FtsZ and the division of prokaryotic cells and organelles. Nat Rev Mol Cell Biol 6: 862–871. - PMC - PubMed
    1. Lutkenhaus J (2007) Assembly dynamics of the bacterial MinCDE system and spatial regulation of the Z ring. Annu Rev Biochem 76: 539–562. - PubMed
    1. Adams DW, Errington J (2009) Bacterial cell division: assembly, maintenance and disassembly of the Z ring. Nat Rev Microbiol 7: 642–653. - PubMed
    1. de Boer PAJ (2010) Advances in understanding E. coli cell fission. Curr Opin Microbiol 13: 730–737. - PMC - PubMed

Publication types

MeSH terms