

Large scale characterization of the LC13 TCR and HLA-B8 structural landscape in reaction to 172 altered peptide ligands: a molecular dynamics simulation study
- PMID: 25101830
- PMCID: PMC4125040
- DOI: 10.1371/journal.pcbi.1003748
Large scale characterization of the LC13 TCR and HLA-B8 structural landscape in reaction to 172 altered peptide ligands: a molecular dynamics simulation study
Abstract
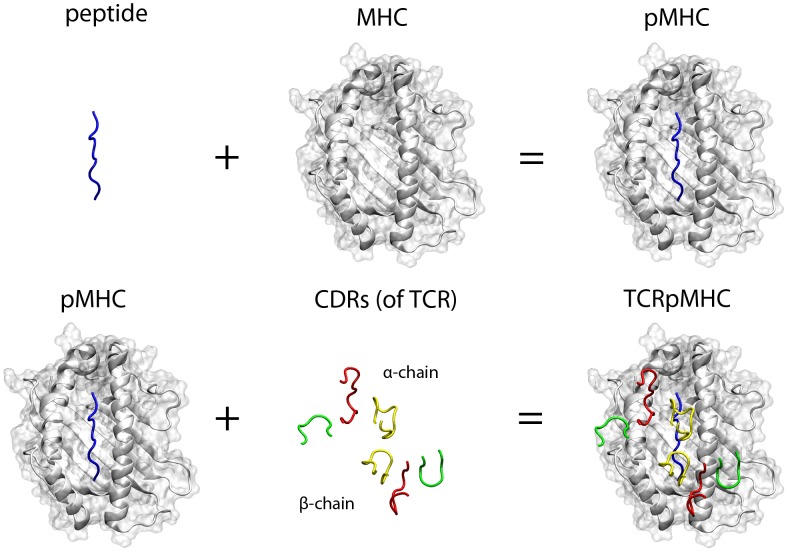
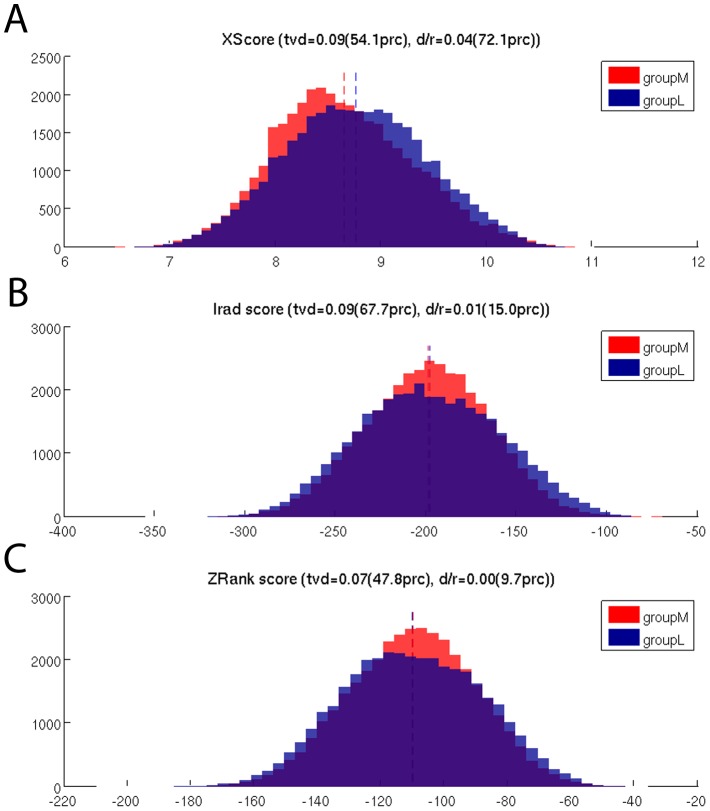
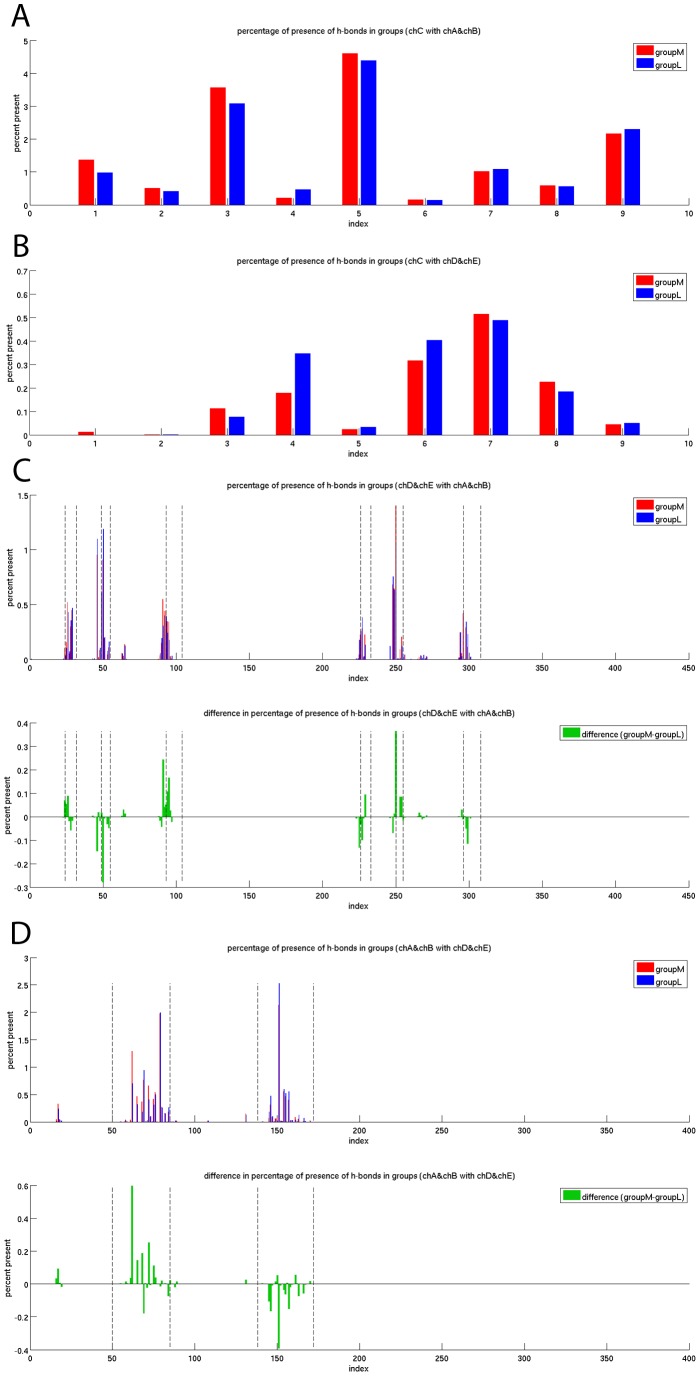
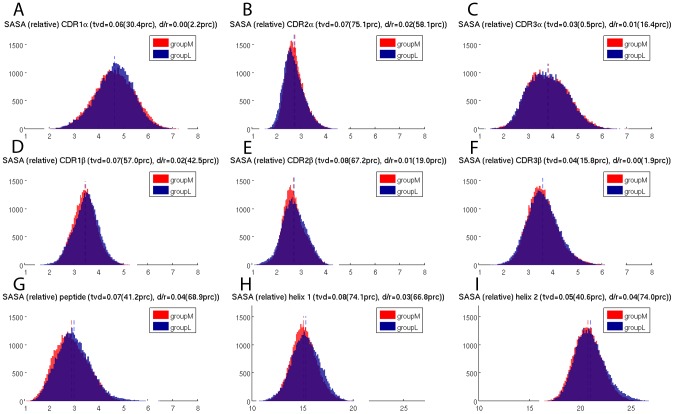
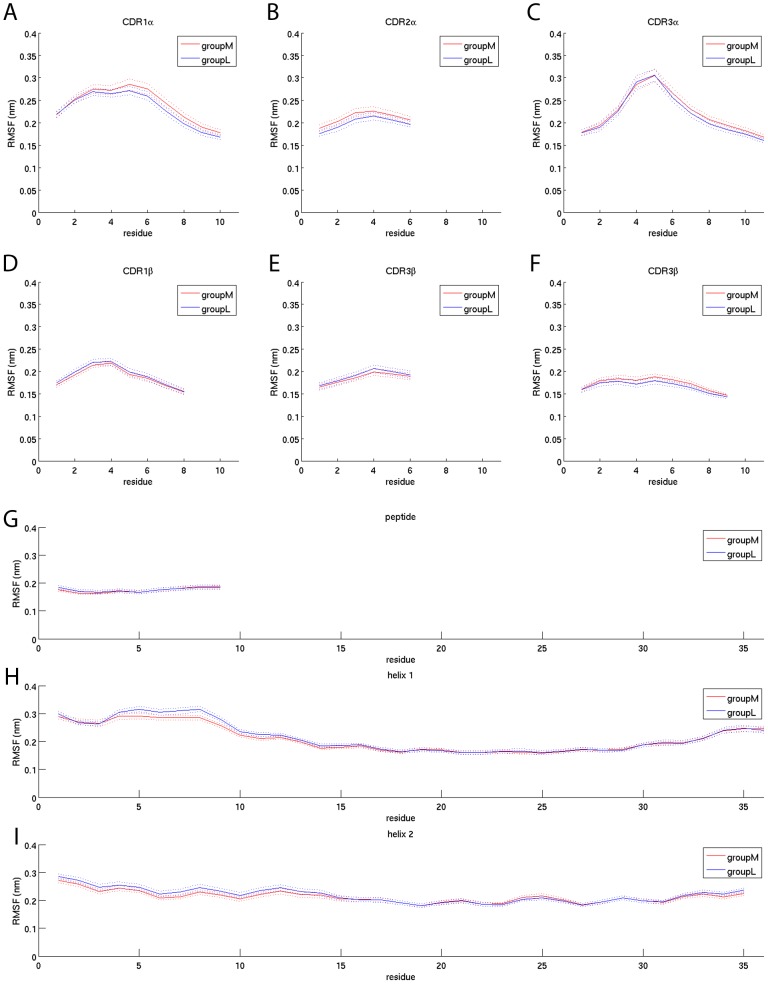
The interplay between T cell receptors (TCRs) and peptides bound by major histocompatibility complexes (MHCs) is one of the most important interactions in the adaptive immune system. Several previous studies have computationally investigated their structural dynamics. On the basis of these simulations several structural and dynamical properties have been proposed as effectors of the immunogenicity. Here we present the results of a large scale Molecular Dynamics simulation study consisting of 100 ns simulations of 172 different complexes. These complexes consisted of all possible point mutations of the Epstein Barr Virus peptide FLRGRAYGL bound by HLA-B*08:01 and presented to the LC13 TCR. We compare the results of these 172 structural simulations with experimental immunogenicity data. We found that simulations with more immunogenic peptides and those with less immunogenic peptides are in fact highly similar and on average only minor differences in the hydrogen binding footprints, interface distances, and the relative orientation between the TCR chains are present. Thus our large scale data analysis shows that many previously suggested dynamical and structural properties of the TCR/peptide/MHC interface are unlikely to be conserved causal factors for peptide immunogenicity.
Conflict of interest statement
The authors have declared that no competing interests exist.
Figures


Similar articles
-
How peptide/MHC presence affects the dynamics of the LC13 T-cell receptor.Sci Rep. 2019 Feb 25;9(1):2638. doi: 10.1038/s41598-019-38788-0. Sci Rep. 2019. PMID: 30804417 Free PMC article.
-
Insights into the structure of the LC13 TCR/HLA-B8-EBV peptide complex with molecular dynamics simulations.Cell Biochem Biophys. 2011 Jul;60(3):283-95. doi: 10.1007/s12013-011-9151-2. Cell Biochem Biophys. 2011. PMID: 21253892
-
The shaping of T cell receptor recognition by self-tolerance.Immunity. 2009 Feb 20;30(2):193-203. doi: 10.1016/j.immuni.2008.11.011. Epub 2009 Jan 22. Immunity. 2009. PMID: 19167249
-
Structural and dynamic control of T-cell receptor specificity, cross-reactivity, and binding mechanism.Immunol Rev. 2012 Nov;250(1):10-31. doi: 10.1111/j.1600-065X.2012.01165.x. Immunol Rev. 2012. PMID: 23046120 Review.
-
The structural interactions between T cell receptors and MHC-peptide complexes place physical limits on self-nonself discrimination.Curr Top Microbiol Immunol. 2005;296:19-37. doi: 10.1007/3-540-30791-5_2. Curr Top Microbiol Immunol. 2005. PMID: 16329190 Review.
Cited by
-
The Hypervariable Loops of Free TCRs Sample Multiple Distinct Metastable Conformations in Solution.Front Mol Biosci. 2018 Nov 13;5:95. doi: 10.3389/fmolb.2018.00095. eCollection 2018. Front Mol Biosci. 2018. PMID: 30483515 Free PMC article.
-
Quantitative Analysis of the Association Angle between T-cell Receptor Vα/Vβ Domains Reveals Important Features for Epitope Recognition.PLoS Comput Biol. 2015 Jul 17;11(7):e1004244. doi: 10.1371/journal.pcbi.1004244. eCollection 2015 Jul. PLoS Comput Biol. 2015. PMID: 26185983 Free PMC article.
-
Structure-based Methods for Binding Mode and Binding Affinity Prediction for Peptide-MHC Complexes.Curr Top Med Chem. 2018;18(26):2239-2255. doi: 10.2174/1568026619666181224101744. Curr Top Med Chem. 2018. PMID: 30582480 Free PMC article. Review.
-
Examining variable domain orientations in antigen receptors gives insight into TCR-like antibody design.PLoS Comput Biol. 2014 Sep 18;10(9):e1003852. doi: 10.1371/journal.pcbi.1003852. eCollection 2014 Sep. PLoS Comput Biol. 2014. PMID: 25233457 Free PMC article.
-
How peptide/MHC presence affects the dynamics of the LC13 T-cell receptor.Sci Rep. 2019 Feb 25;9(1):2638. doi: 10.1038/s41598-019-38788-0. Sci Rep. 2019. PMID: 30804417 Free PMC article.
References
-
- Janeway CA, Travers P, Walport M, Shlomchik MJ (2005) Immuno Biology. New York: Garland Science.
-
- Lautscham G, Rickinson A, Blake N (2003) TAP-independent antigen presentation on MHC class I molecules: lessons from Epstein-Barr virus. Microbes Infect 5: 291–299. - PubMed
-
- Schubert B, Lund O, Nielsen M (2013) Evaluation of peptide selection approaches for epitope-based vaccine design. Tissue Antigens 82: 243–251. - PubMed
Publication types
MeSH terms
Substances
LinkOut - more resources
Full Text Sources
Other Literature Sources
Research Materials
Miscellaneous
