. 2014 Aug 7;10(8):e1004507.
doi: 10.1371/journal.pgen.1004507. eCollection 2014 Aug.

KDM6 demethylase independent loss of histone H3 lysine 27 trimethylation during early embryonic development

Affiliations

KDM6 demethylase independent loss of histone H3 lysine 27 trimethylation during early embryonic development

Karl B Shpargel et al. PLoS Genet. .

Abstract

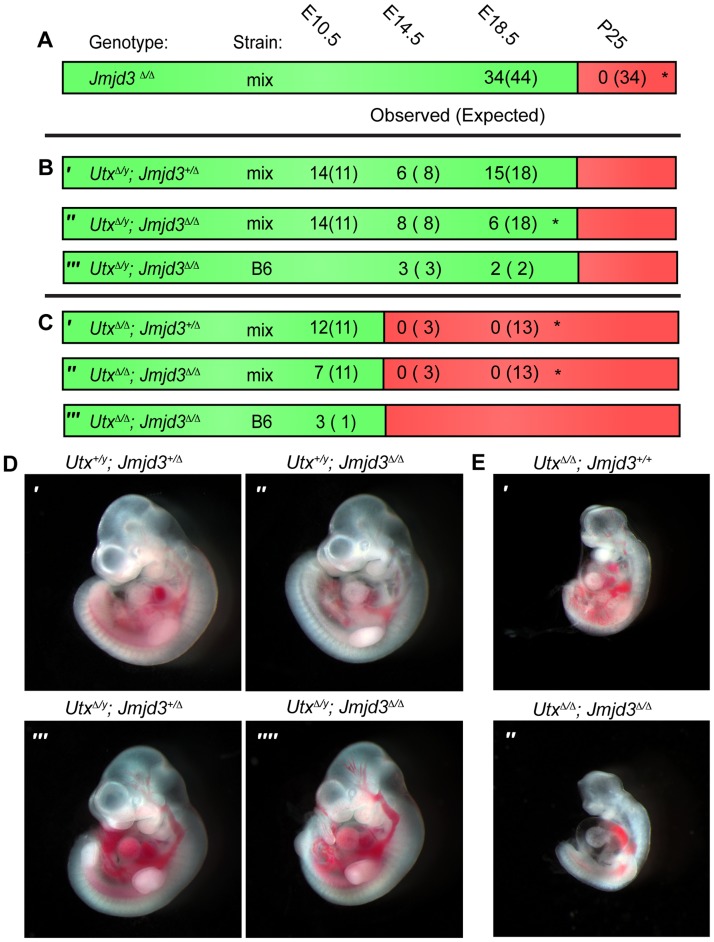
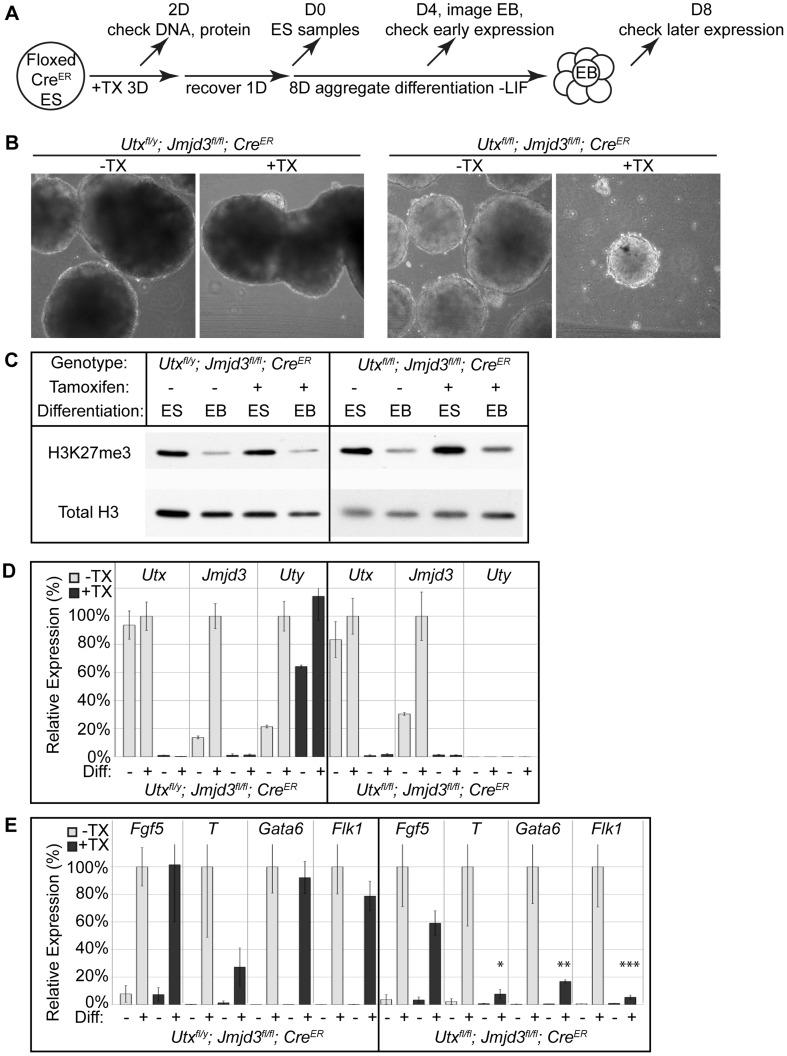
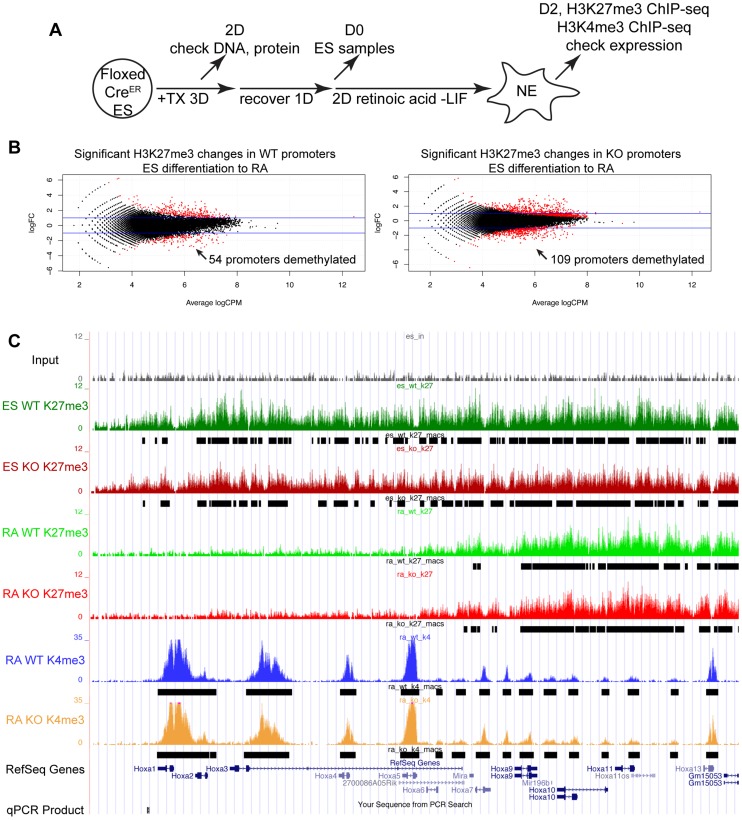
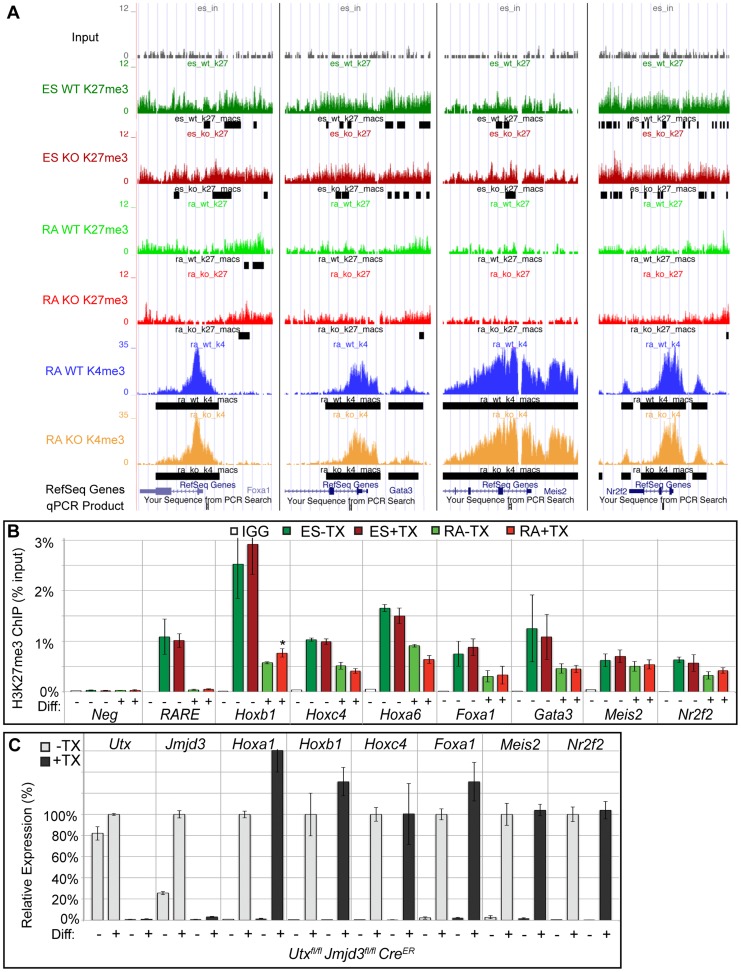
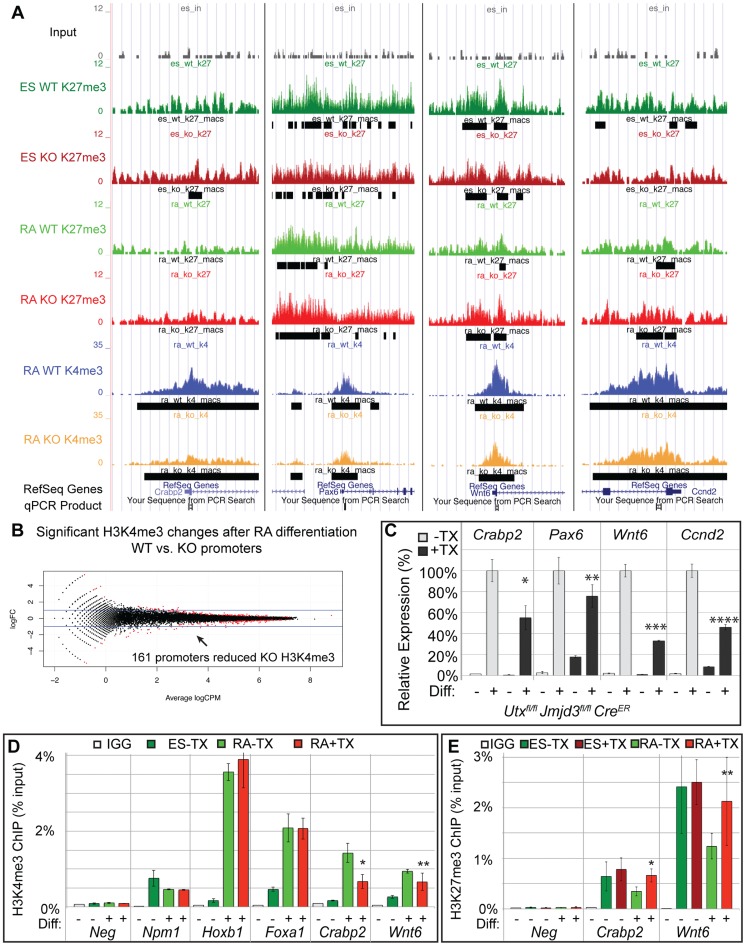
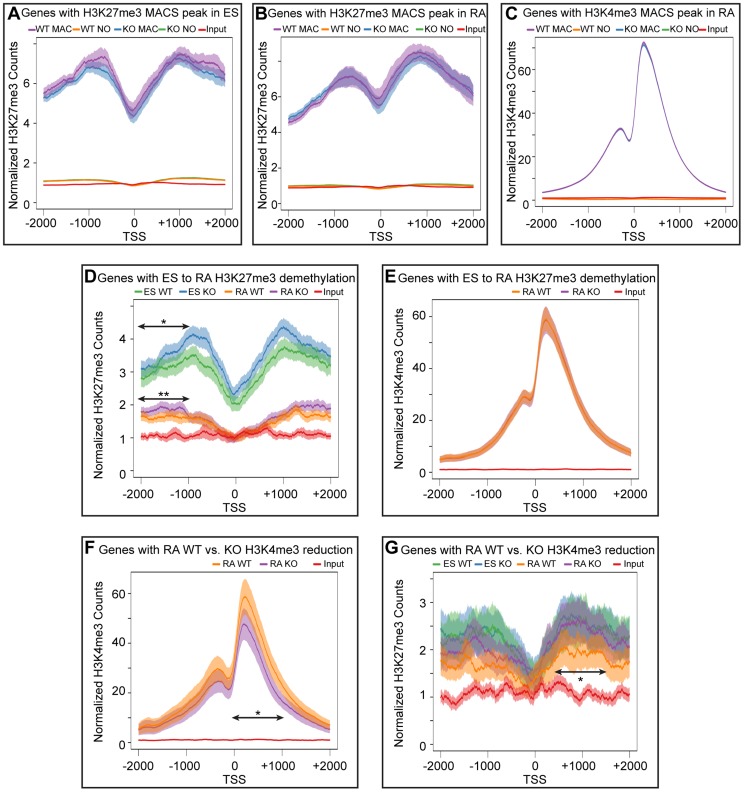
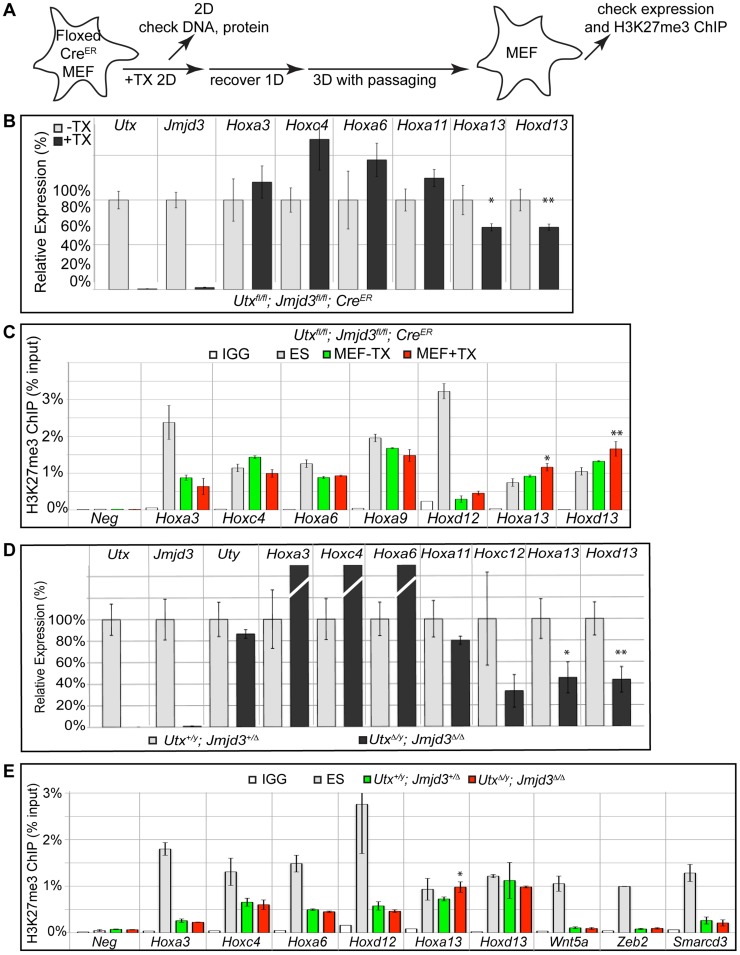
The early mammalian embryo utilizes histone H3 lysine 27 trimethylation (H3K27me3) to maintain essential developmental genes in a repressive chromatin state. As differentiation progresses, H3K27me3 is removed in a distinct fashion to activate lineage specific patterns of developmental gene expression. These rapid changes in early embryonic chromatin environment are thought to be dependent on H3K27 demethylases. We have taken a mouse genetics approach to remove activity of both H3K27 demethylases of the Kdm6 gene family, Utx (Kdm6a, X-linked gene) and Jmjd3 (Kdm6b, autosomal gene). Male embryos null for active H3K27 demethylation by the Kdm6 gene family survive to term. At mid-gestation, embryos demonstrate proper patterning and activation of Hox genes. These male embryos retain the Y-chromosome UTX homolog, UTY, which cannot demethylate H3K27me3 due to mutations in catalytic site of the Jumonji-C domain. Embryonic stem (ES) cells lacking all enzymatic KDM6 demethylation exhibit a typical decrease in global H3K27me3 levels with differentiation. Retinoic acid differentiations of these ES cells demonstrate loss of H3K27me3 and gain of H3K4me3 to Hox promoters and other transcription factors, and induce expression similar to control cells. A small subset of genes exhibit decreased expression associated with reduction of promoter H3K4me3 and some low-level accumulation of H3K27me3. Finally, Utx and Jmjd3 mutant mouse embryonic fibroblasts (MEFs) demonstrate dramatic loss of H3K27me3 from promoters of several Hox genes and transcription factors. Our results indicate that early embryonic H3K27me3 repression can be alleviated in the absence of active demethylation by the Kdm6 gene family.


Conflict of interest statement

The authors have declared that no competing interests exist.

Figures

Figure 1
Figure 1. Utx and Jmjd3 mutant phenotypes.
(A–C) Observed and Expected (in parentheses) numbers of indicated genotypes at embryonic (day 10.5, 14.5 or 18.5) or postnatal (day 25, weaning) timepoints. Data are included for Jmjd3 Δ/Δ (A), Utx Δ/y;Jmjd3 +/Δ (B′), Utx Δ/y;Jmjd3 Δ/Δ (B″ and B′″), Utx Δ/Δ;Jmjd3 +/ Δ (C′), and Utx Δ/Δ;Jmjd3 Δ/Δ (C″ and C′″) genotypes. Green regions denote viability and red denotes lethality. Mix denotes a mixed genetic background and B6 has been backcrossed to C57BL6 for >5 generations. Significant deviations from expected allele frequencies as determined by χ2 p-value are: (A) *<0.001, (B) * = 0.005, and (C) *<0.001. (D,E) Embryonic day 10.5 images of (D) male Utx+/y;Jmjd3 +/Δ (D′), Utx+/y;Jmjd3 Δ/Δ (D″), Utx Δ/ y;Jmjd3 +/Δ (D′″), Utx Δ/ y;Jmjd3 Δ/Δ (D″″) embryos and (E) female Utx Δ/Δ (E′) and Utx Δ/Δ;Jmjd3 Δ/Δ (E″) embryos, B6 background.
Figure 2
Figure 2. EB differentiation of male and female Utx and Jmjd3 mutant ES cell lines.
(A) Utxfl/y;Jmjd3fl/fl;CreER or Utxfl/fl;Jmjd3fl/fl;CreER ES cell lines were left untreated (−TX) or treated with tamoxifen for 3 days (+TX), then differentiated in aggregate suspension culture (EB). (B) Images of day 4 EBs. (C) Histones were extracted from Utxfl/y;Jmjd3fl/fl;CreER or Utxfl/fl;Jmjd3fl/fl;CreER ES cells (Differentiation ES) or day 4 EBs (Differentiation EB) left untreated (Tamoxifen −) or pre-treated with tamoxifen (Tamoxifen +) and western blotted for H3K27me3 relative to total H3 loading control. (D) Quantitative RT-PCR of Utx, Jmjd3, or Uty from day 0 Utxfl/y;Jmjd3fl/fl;CreER or Utxfl/fl;Jmjd3fl/fl;CreER ES cells (Differentiation −) or day 8 EBs (Differentiation +) left untreated (−TX, light grey) or pre-treated with tamoxifen (+TX, black). RT-PCR is across deleted Utx and Jmjd3 exons. N = 3 samples per treatment. All samples are normalized relative to −TX Differentiation + within individual male or female lines. (E) Quantitative RT-PCR of Fgf5 (EB day 4), Brachyury T (T, EB day 4), Gata6 (EB day 8), or Flk1 (EB day 8) from Utxfl/y;Jmjd3fl/fl;CreER or Utxfl/fl;Jmjd3fl/fl;CreER ES cells (Diff −) or indicated EB timepoint (Diff +) left untreated (−TX, light grey) or pre-treated with tamoxifen (+TX, black). All samples are normalized relative to −TX Differentiation + within individual male or female lines. Significant reductions in expression are indicated (T-test p-values * = 0.02, ** = 0.005, *** = 0.006, N = 3 samples per treatment).
Figure 3
Figure 3. Proximal Hox genes demonstrate loss of H3K27me3 with RA treatment in the absence of KDM6 demethylation.
(A) Utxfl/fl;Jmjd3fl/fl;CreER ES cells were untreated (WT) or pre-treated with TX for 3 days (KO), recovered, and differentiated to neuro-ectoderm with 2 days of retinoic acid treatment. H3K27me3 and H3K4me3 ChIP-seq were performed on D0 ES cells and D2 RA treated cells. (B) The normalized sequence reads from all promoters (+/−1 KB KB) from ES and RA treated cells were compared by edgeR to identify promoters that exhibit H3K27me3 reductions in either WT (Utxfl/fl;Jmjd3fl/fl;CreER −TX) or KO (Utxfl/fl;Jmjd3fl/fl;CreER +TX) cells. The log fold change (logFC) is plotted against the average log counts per million reads (Average logCPM). In the plot, 54 WT and 109 KO promoters exhibited H3K27me3 reductions with RA treatment (negative logFC, FDR<0.05, and an identified H3K27me3 MACS peak in ES cells). (C) UCSC genome browser view of ChIP-seq tracks for the Hoxa cluster. Illustrated are Input (black), WT ES H3K27me3 ChIP (dark green), KO ES H3K27me3 ChIP (dark red), WT RA H3K27me3 ChIP (light green), KO RA H3K27me3 ChIP (light red), WT RA H3K4me3 ChIP (blue), KO RA H3K4me3 ChIP (orange), and MACS defined enrichment peaks are illustrated as black bars underneath each track. The RARE region tested by ChIP-qPCR is noted on the bottom.
Figure 4
Figure 4. Several developmental genes demonstrate loss of H3K27me3 with RA treatment in the absence of KDM6 demethylation.
(A) UCSC genome browser view of Foxa1, Gata3, Meis2, and Nr2f2. Illustrated are Input (black), WT ES H3K27me3 ChIP (dark green), KO ES H3K27me3 ChIP (dark red), WT RA H3K27me3 ChIP (light green), KO RA H3K27me3 ChIP (light red), WT RA H3K4me3 ChIP (blue), KO RA H3K4me3 ChIP (orange), and MACS defined enrichment peaks are illustrated as black bars underneath each track. Regions tested by ChIP-qPCR are noted on the bottom. (B) Verification of H3K27me3 loss by ChIP-qPCR. H3K27me3 ChIP of Utxfl/fl;Jmjd3fl/fl;CreER ES cells (dark green and red, Diff −) or after 2 days of RA treatment (light green or red, Diff +) left untreated (green) or pre-treated with tamoxifen (red). An IgG control ChIP is illustrated as white bars. Quantitative PCR of a H3K27me3 negative locus (Slc2a8 promoter, Neg) was utilized for comparison to the Hox A cluster retinoic acid response element (RARE), Hoxb1, Hoxc4, Hoxa6, Foxa1, Gata3, Meis2, and Nr2f2 promoters. N = 4 samples per treatment. All genes tested exhibited demethylation in both WT and KO cells, with only Hoxb1 demonstrating a slight, but significant increase in KO RA treatment (p-value = 0.03). (C) Quantitative RT-PCR of Utx, Jmjd3, and indicated Hox genes, Foxa1, Meis2, and Nr2f2 from Utxfl/fl;Jmjd3fl/fl;CreER ES cells (Diff −) or after 2 days of RA treatment (Diff +) left untreated (−TX, light grey) or pre-treated with tamoxifen (+TX, black). N = 3 samples per treatment. All samples are normalized relative to −TX Differentiation + RA treatment. No genes tested demonstrated significantly reduced expression in KO RA cells.
Figure 5
Figure 5. A subset of genes exhibit reduction of H3K4me3 with loss of UTX and JMJD3.
(A) UCSC genome browser view of Crabp2, Pax6, Wnt6, and Ccnd2. Illustrated are Input (black), WT ES H3K27me3 ChIP (dark green), KO ES H3K27me3 ChIP (dark red), WT RA H3K27me3 ChIP (light green), KO RA H3K27me3 ChIP (light red), WT RA H3K4me3 ChIP (blue), KO RA H3K4me3 ChIP (orange), and MACS defined enrichment peaks are illustrated as black bars underneath each track. Regions tested by ChIP-qPCR are noted on the bottom. (B) H3K4me3 ChIP-seq was performed on WT (Utxfl/fl;Jmjd3fl/fl;CreER −TX) or KO (Utxfl/fl;Jmjd3fl/fl;CreER +TX) cells treated with RA. The normalized sequence reads from all promoters (+/−1 KB KB) from RA treated cells were compared by edgeR to identify promoters that exhibit H3K4me3 reductions in KO cells. The log fold change (logFC) is plotted against the average log counts per million reads (Average logCPM). In the plot, 161 KO promoters exhibited H3K27me3 reductions with RA treatment (negative logFC, FDR<0.05, and an identified H3K4me3 MACS peak in WT RA cells). (C) Quantitative RT-PCR of Crabp2, Pax6, Wnt6, and Ccnd2 from Utxfl/fl;Jmjd3fl/fl;CreER ES cells (Diff −) or after 2 days of RA treatment (Diff +) left untreated (−TX, light grey) or pre-treated with tamoxifen (+TX, black). N = 3 samples per treatment. All samples are normalized relative to −TX Differentiation + RA treatment. Significantly reduced expression is demonstrated (p-vale = *0.01, **0.03, ***0.001, ****0.004). (D) Verification of H3K4me3 reductions in KO RA cells by ChIP-qPCR. H3K4me3 ChIP of Utxfl/fl;Jmjd3fl/fl;CreER ES cells (dark green, Diff −) or after 2 days of RA treatment (light green or red, Diff +) left untreated (green) or pre-treated with tamoxifen (red). An IgG control ChIP is illustrated as white bars. Quantitative PCR of a H3K4me3 negative locus (gene desert region, Neg) was utilized for comparison to Npm1 (a positive control), genes exhibiting normal KO gene activation (Hoxb1, Foxa1), and genes with reductions in KO H3K4me3 (Crabp2, Wnt6). Only Crabp2 and Wnt6 demonstrated decreases in KO RA treatment (p-value = *0.01, **0.07). (E) H3K27me3 ChIP of Crabp2 and Wnt6 relative to a negative control (Slc2a8). Both genes demonstrated increases in H3K27me3 in RA KO cells (light red bars, p-value = *0.003, **0.03).
Figure 6
Figure 6. Meta-analysis of H3K27me3 and H3K4me3 distribution across female KDM6 WT and KO promoters.
(A) Meta-analysis plotted the normalized H3K27me3 sequence reads and corresponding 95% confidence interval for all female KDM6 WT and KO ES promoters with a H3K27me3 MACS peak against all promoters without a MACS peak. Gene distributions span −2000 base pairs upstream of the transcription start site (TSS) to +2000 downstream. (B) Normalized H3K27me3 sequence reads for all WT and KO RA promoters with a H3K27me3 MACS peak against all promoters without a MACS peak. (C) Normalized H3K4me3 sequence reads for all WT and KO RA promoters with a H3K4me3 MACS peak against all promoters without a MACS peak. (D) Normalized H3K27me3 sequence reads across promoters identified by edgeR to experience H3K27me3 loss with RA differentiation. ES WT and KO vs. RA WT and KO are illustrated. While there is a large drop-off in both WT and KO RA counts, KO ES and KO RA was slightly elevated relative to WT ES and WT RA respectively across −1000 to −2000 (Ttest of means for all given promoters, p-value = *0.036, **0.019) (E) Normalized H3K4me3 sequence reads across promoters identified by edgeR to experience H3K27me3 loss with RA differentiation. RA WT and KO are illustrated. (F) Normalized H3K4me3 sequence reads across promoters identified by edgeR to experience H3K4me3 loss in KO RA relative to WT RA. RA WT and KO are illustrated. KO RA is significantly reduced across 0 to +1000 (p-value = *0.009). (G) Normalized H3K27me3 sequence reads across promoters identified by edgeR to experience H3K4me3 loss in KO RA relative to WT RA. ES WT and KO vs. RA WT and KO are illustrated. KO RA was significanly elevated relative to WT RA across +500 to +1500 (p-value = *0.040).
Figure 7
Figure 7. RT-PCR and H3K27me3 ChIP of Utx and Jmjd3 mutant MEFs.
(A) Schematic of MEF TX treatment. (B) Quantitative RT-PCR of indicated genes from Utxfl/fl;Jmjd3fl/fl;CreER mouse embryonic fibroblasts (MEFs) left untreated (−TX, light grey) or pre-treated with TX (+TX, black). Significant reductions in Hox expression are indicated (T-test p-value * = 0.05, ** = 0.02, N = 3 samples per treatment). (C) H3K27me3 ChIP of Utxfl/fl;Jmjd3fl/fl;CreER MEFs left untreated (green) or pre-treated with TX (red). An IgG control ChIP is illustrated as white bars and H3K27me3 ChIP of ES cells is illustrated as light grey bars. Quantitative PCR of a H3K27me3 negative locus (Slc2a8 promoter, Neg) was utilized for comparison to Hox promoters. Significant H3K27me3 accumulations of MEF +TX relative to −TX are indicated (T-test p-value * = 0.01, ** = 0.04, N = 3 samples per treatment). (D) Quantitative RT-PCR of indicated genes from Utx+/y;Jmjd3+/Δ (light grey bars) or UtxΔ/y;Jmjd3Δ/Δ MEFs (black bars). Significant reductions in Hox expression are indicated (T-test p-value * = 0.01, ** = 0.003, N = 3 independent MEF lines per treatment). (E) H3K27me3 ChIP of Utx+/y;Jmjd3+/Δ (green bars) or UtxΔ/y;Jmjd3Δ/Δ MEFs (red bars). An IgG control ChIP is illustrated as white bars and H3K27me3 ChIP of ES cells is illustrated as light grey bars. Quantitative PCR of a H3K27me3 negative locus (Slc2a8 promoter, Neg) was utilized for comparison to promoters of Hox genes and other indicated transcription factors. Significant H3K27me3 accumulations of UtxΔ/y;Jmjd3Δ/Δ MEFs relative to Utx+/y;Jmjd3+/Δ MEFs are indicated (T-test p-value * = 0.02, N = 3 samples per treatment).

Similar articles

Cited by

References

    1. Azuara V, Perry P, Sauer S, Spivakov M, Jorgensen HF, et al. (2006) Chromatin signatures of pluripotent cell lines. Nat Cell Biol 8: 532–538. - PubMed
    1. Bernstein BE, Mikkelsen TS, Xie X, Kamal M, Huebert DJ, et al. (2006) A bivalent chromatin structure marks key developmental genes in embryonic stem cells. Cell 125: 315–326. - PubMed
    1. Ku M, Koche RP, Rheinbay E, Mendenhall EM, Endoh M, et al. (2008) Genomewide analysis of PRC1 and PRC2 occupancy identifies two classes of bivalent domains. PLoS Genet 4: e1000242. - PMC - PubMed
    1. Mikkelsen TS, Ku M, Jaffe DB, Issac B, Lieberman E, et al. (2007) Genome-wide maps of chromatin state in pluripotent and lineage-committed cells. Nature 448: 553–560. - PMC - PubMed
    1. Rugg-Gunn PJ, Cox BJ, Ralston A, Rossant J (2010) Distinct histone modifications in stem cell lines and tissue lineages from the early mouse embryo. Proc Natl Acad Sci U S A 107: 10783–10790. - PMC - PubMed

Publication types