. 2014 Aug 7;10(8):e1004555.
doi: 10.1371/journal.pgen.1004555. eCollection 2014 Aug.

A genetic strategy to measure circulating Drosophila insulin reveals genes regulating insulin production and secretion

Affiliations

A genetic strategy to measure circulating Drosophila insulin reveals genes regulating insulin production and secretion

Sangbin Park et al. PLoS Genet. .

Abstract

Insulin is a major regulator of metabolism in metazoans, including the fruit fly Drosophila melanogaster. Genome-wide association studies (GWAS) suggest a genetic basis for reductions of both insulin sensitivity and insulin secretion, phenotypes commonly observed in humans with type 2 diabetes mellitus (T2DM). To identify molecular functions of genes linked to T2DM risk, we developed a genetic tool to measure insulin-like peptide 2 (Ilp2) levels in Drosophila, a model organism with superb experimental genetics. Our system permitted sensitive quantification of circulating Ilp2, including measures of Ilp2 dynamics during fasting and re-feeding, and demonstration of adaptive Ilp2 secretion in response to insulin receptor haploinsufficiency. Tissue specific dissection of this reduced insulin signaling phenotype revealed a critical role for insulin signaling in specific peripheral tissues. Knockdown of the Drosophila orthologues of human T2DM risk genes, including GLIS3 and BCL11A, revealed roles of these Drosophila genes in Ilp2 production or secretion. Discovery of Drosophila mechanisms and regulators controlling in vivo insulin dynamics should accelerate functional dissection of diabetes genetics.


Conflict of interest statement

The authors have declared that no competing interests exist.

Figures
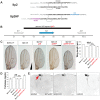
Figure 1
Figure 1. Epitope-tagged Ilp2 rescues insulin deficiency phenotypes.
(A) Prepro-Ilp2 peptide sequence and locations of HA (blue) and FLAG (purple) epitopes inserted in Ilp2HF sequence. The sequences in black represent the putative mature Ilp2. Gray bars indicate conserved cysteine bonds in insulin-like peptides. (B) 2.4 kilobase pair genomic fragment (black bar) containing Ilp2 gene and its regulatory sequence. (C) Quantification of wing length in flies lacking Ilp2, Ilp3 and Ilp5 genes (Ilp2–3, 5) with or without gd2, gd2HF, and gd2HF.C119Y genomic rescue fragments, as indicated. (D) Measurement of hemolymph trehalose concentration in insulin deficient flies with or without gd2 or gd2HF, and gd2HF.C119Y. (E) Expression of Ilp2HF in Ilp21 gd2HF adult insulin producing neurons (arrow) detected by anti-Ilp2, anti-FLAG, and anti-HA antibodies. In all figures, center values are averages, error bars represent the standard deviation, and two-tailed t-tests were used to generate p values. * indicates p<0.05, ** p<0.01, and *** p<0.001. N.S. indicates statistically not significant.
Figure 2
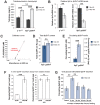
Figure 2. Physiological regulation of Ilp2HF production and secretion.
(A) hemolymph trehalose concentrations in 1 and 3 day-old y1 w1118 control and Ilp21 gd2HF flies. (B) Ilp2 or Ilp2HF mRNA levels in 1 and 3 day-old y1 w1118 control and Ilp21 gd2HF flies. (C) Circulating Ilp2HF concentration in hemolymph was determined by sandwich ELISA using 41 pM (0.1 pg/µl) to 4150 pM (10 pg/µl) of FLAG(GS)HA, a peptide harboring FLAG and HA epitopes, but up to 830 pM are shown in the curve. (D) Measurement of the total Ilp2HF content in 1 and 3 day-old Ilp21 gd2HF flies. (E) Circulating Ilp2HF concentration (pM) or content per fly (pg) in 1 and 3 day-old Ilp21 gd2HF flies. (F) Secreted and remaining Ilp2HF content from isolated Ilp21 gd2HF heads that were incubated in 3 mM or 100 mM KCl. (G) Oral glucose-stimulated insulin secretion and clearance in 3 day-old Ilp21 gd2HF flies, measured by insulin ELISA. Circulating Ilp2HF was measured at 24 hours of fasting, or at 0, 30, 60, and 90 minutes after feeding with 2 M glucose for 30 minutes. In all figures, center values are averages, error bars represent the standard deviation, and two-tailed t-tests were used to generate p values. * indicates p<0.05, ** p<0.01, and *** p<0.001. N.S. indicates statistically not significant.
Figure 3
Figure 3. IPC-specific regulators of circulating Ilp2HF.
(A) Circulating hemolymph Ilp2HF levels in heterozygous Ilp21 gd2HF flies expressing control tdTomato or Kir2.1 by Ilp2-GeneSwitch (Ilp2GS) for 2 days with or without Mifepristone feeding. (B) Quantification of IPC cell number in flies expressing control tdTomato or Kir2.1 by Ilp2-GeneSwitch (Ilp2GS) for 2 days with Mifepristone feeding. IPCs were marked by dilp215-1-HStinger. (C) Ilp2 mRNA levels in heterozygous Ilp21 gd2HF flies with IPC-specific RNAi knockdown of CG9650, Glut1, lmd, and Ilp2 genes or control mCherry RNAi. (D) Total Ilp2HF protein content in heterozygous Ilp21 gd2HF flies with IPC-specific RNAi knockdown of CG9650, Glut1, lmd, and Ilp2 genes or control mCherry RNAi. (E) Circulating Ilp2HF concentration (pM) or content per fly (pg) in heterozygous Ilp21 gd2HF flies with IPC-specific RNAi knockdown of CG9650, Glut1, lmd, and Ilp2 genes or control mCherry RNAi. In all figures, center values are averages, error bars represent the standard deviation, and two-tailed t-tests were used to generate p values. * indicates p<0.05, ** p<0.01, and *** p<0.001. N.S. indicates statistically not significant.
Figure 4
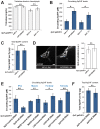
Figure 4. Enhanced insulin secretion from impaired peripheral insulin signaling in Drosophila.
(A) Circulating trehalose levels in InR or Akt1 heterozygous mutants and sibling wild type control flies. (B) Circulating Ilp2HF levels in InR or Akt1 heterozygous mutants and sibling wild type control flies. (C) Total Ilp2HF amounts in InR heterozygous mutants and sibling wild type control flies. (D) Representative image of Ilp2 immunofluorescence in IPCs of InR heterozygous mutants and sibling wild type control flies, and average mean signal intensity quantified from summed z-projections (n = 9). Scale bar is 10 µm. (E) Circulating Ilp2HF levels in flies with tissue-specific RNAi knockdown of InR. InR was knocked down in IPCs (Ilp2>), muscle (Mef2>), or adult fat body (Lk6> and ppl>) tissues. (F) Total Ilp2HF content in flies with adult fat body specific RNAi knockdown of InR using ppl-GAL4. In all figures, center values are averages, error bars represent the standard deviation, and two-tailed t-tests were used to generate p values. * indicates p<0.05, ** p<0.01, and *** p<0.001. N.S. indicates statistically not significant.

References

    1. Kasuga M (2006) Insulin resistance and pancreatic beta cell failure. J Clin Invest 116: 1756–1760. - PMC - PubMed
    1. Imamura M, Maeda S (2011) Genetics of type 2 diabetes: the GWAS era and future perspectives. Endocr J 58: 723–739. - PubMed
    1. Rulifson EJ, Kim SK, Nusse R (2002) Ablation of insulin-producing neurons in flies: growth and diabetic phenotypes. Science 296: 1118–1120. - PubMed
    1. Ikeya T, Galic M, Belawat P, Nairz K, Hafen E (2002) Nutrient-dependent expression of insulin-like peptides from neuroendocrine cells in the CNS contributes to growth regulation in Drosophila. Curr Biol 12: 1293–1300. - PubMed
    1. Grönke S, Clarke DF, Broughton S, Andrews TD, Partridge L (2010) Molecular evolution and functional characterization of Drosophila insulin-like peptides. PLoS Genet 6: e1000857. - PMC - PubMed

Publication types

MeSH terms