

A hepatitis C virus infection model with time-varying drug effectiveness: solution and analysis
- PMID: 25101902
- PMCID: PMC4125050
- DOI: 10.1371/journal.pcbi.1003769
A hepatitis C virus infection model with time-varying drug effectiveness: solution and analysis
Abstract
Simple models of therapy for viral diseases such as hepatitis C virus (HCV) or human immunodeficiency virus assume that, once therapy is started, the drug has a constant effectiveness. More realistic models have assumed either that the drug effectiveness depends on the drug concentration or that the effectiveness varies over time. Here a previously introduced varying-effectiveness (VE) model is studied mathematically in the context of HCV infection. We show that while the model is linear, it has no closed-form solution due to the time-varying nature of the effectiveness. We then show that the model can be transformed into a Bessel equation and derive an analytic solution in terms of modified Bessel functions, which are defined as infinite series, with time-varying arguments. Fitting the solution to data from HCV infected patients under therapy has yielded values for the parameters in the model. We show that for biologically realistic parameters, the predicted viral decay on therapy is generally biphasic and resembles that predicted by constant-effectiveness (CE) models. We introduce a general method for determining the time at which the transition between decay phases occurs based on calculating the point of maximum curvature of the viral decay curve. For the parameter regimes of interest, we also find approximate solutions for the VE model and establish the asymptotic behavior of the system. We show that the rate of second phase decay is determined by the death rate of infected cells multiplied by the maximum effectiveness of therapy, whereas the rate of first phase decline depends on multiple parameters including the rate of increase of drug effectiveness with time.
Conflict of interest statement
The authors have declared that no competing interests exist.
Figures
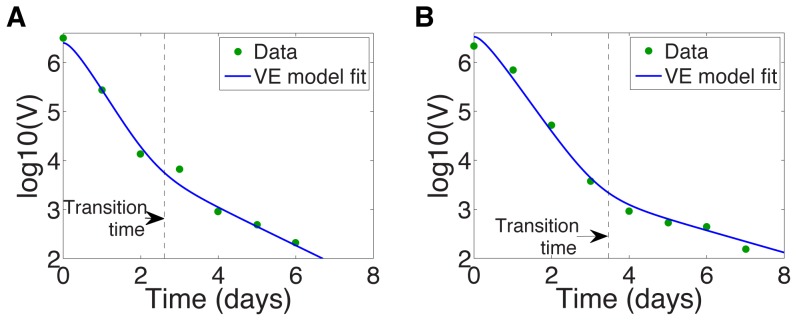
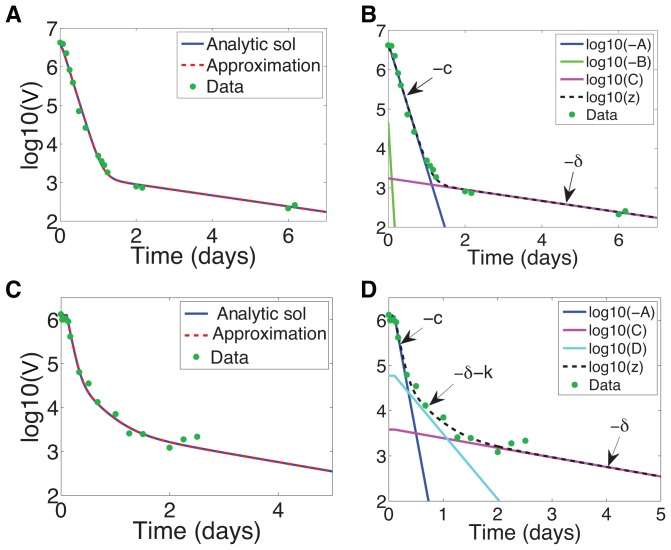
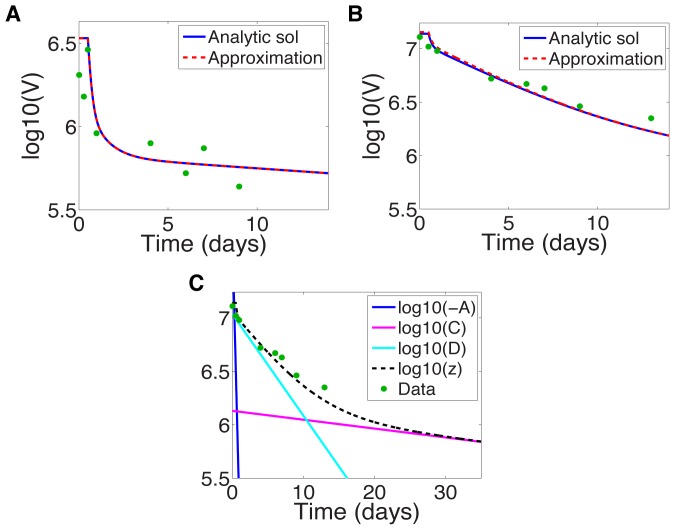
 , is calculated by maximizing the curvature
  in equation (14), and is marked by a vertical dashed line. VE model fit of Canini et al. (solid line) and HCV viral load data (dots) for (a) Patient 46, with transition time
  days, and for (b) Patient 48, with transition time
  days.
days.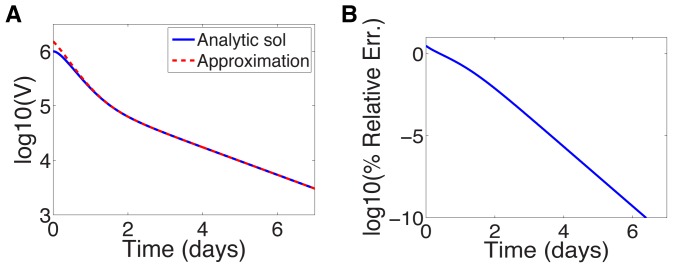
 . (b) Relative error in
  of approximation.
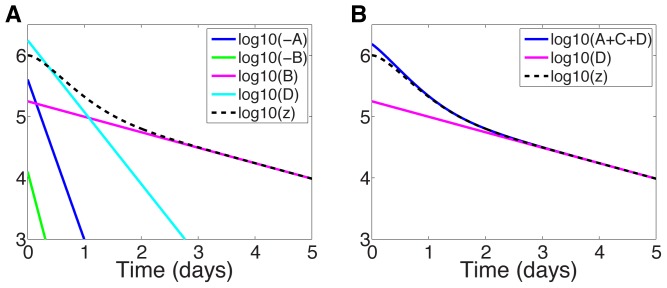
 ,
,  ,
,  ,
,  ,
,  ,
,  , and
, and  [unpublished]. Telaprevir treatment: data from patient 6 in with associated parameter estimates
  ,
,  ,
,  ,
,  ,
,  ,
,  , and
, and  .
.
 ,
,  ,
,  ,
,  ,
,  ,
,  , and
, and  ; for patient 92103,
  ,
,  ,
,  ,
,  ,
,  ,
,  , and
, and  .
.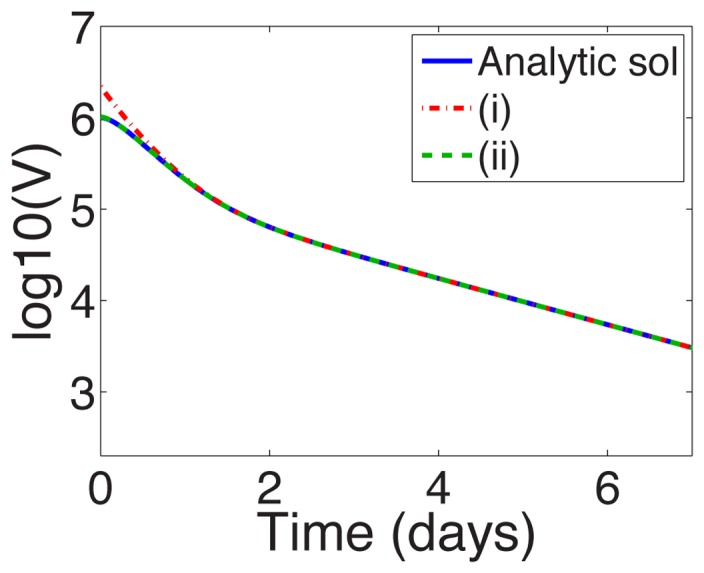
 ,
,  ,
,  , and
, and  terms, included in the approximation (16), from the series solution (19); (ii) Series terms with exponents from (i) and also the
  and
and  terms missing from the approximation.
Similar articles
-
Triphasic decline of hepatitis C virus RNA during antiviral therapy.Hepatology. 2007 Jul;46(1):16-21. doi: 10.1002/hep.21657. Hepatology. 2007. PMID: 17596864
-
Understanding hepatitis C viral dynamics with direct-acting antiviral agents due to the interplay between intracellular replication and cellular infection dynamics.J Theor Biol. 2010 Dec 7;267(3):330-40. doi: 10.1016/j.jtbi.2010.08.036. Epub 2010 Sep 8. J Theor Biol. 2010. PMID: 20831874
-
New kinetic models for the hepatitis C virus.Hepatology. 2005 Oct;42(4):749-54. doi: 10.1002/hep.20882. Hepatology. 2005. PMID: 16175615 Review.
-
An ODEs multiscale model with cell proliferation for hepatitis C virus infection treated with direct acting antiviral agents.J Biol Dyn. 2024 Dec;18(1):2423956. doi: 10.1080/17513758.2024.2423956. Epub 2024 Nov 13. J Biol Dyn. 2024. PMID: 39535248
-
Mathematical modelling of HCV infection: what can it teach us in the era of direct-acting antiviral agents?Antivir Ther. 2012;17(6 Pt B):1171-82. doi: 10.3851/IMP2428. Epub 2012 Oct 5. Antivir Ther. 2012. PMID: 23186606 Free PMC article. Review.
Cited by
-
A pharmacokinetic/viral kinetic model to evaluate the treatment effectiveness of danoprevir against chronic HCV.Antivir Ther. 2015;20(5):469-77. doi: 10.3851/IMP2879. Epub 2014 Oct 16. Antivir Ther. 2015. PMID: 25321394 Free PMC article. Clinical Trial.
-
HCV Kinetic Models and Their Implications in Drug Development.CPT Pharmacometrics Syst Pharmacol. 2015 Apr;4(4):231-42. doi: 10.1002/psp4.28. Epub 2015 Apr 17. CPT Pharmacometrics Syst Pharmacol. 2015. PMID: 26225247 Free PMC article. Review.
-
The risk of drug resistance during long-acting antimicrobial therapy.Proc Biol Sci. 2022 Nov 9;289(1986):20221444. doi: 10.1098/rspb.2022.1444. Epub 2022 Nov 9. Proc Biol Sci. 2022. PMID: 36350211 Free PMC article.
-
A multiscale model of virus pandemic: Heterogeneous interactive entities in a globally connected world.Math Models Methods Appl Sci. 2020 Jul;30(8):1591-1651. doi: 10.1142/s0218202520500323. Epub 2020 Aug 19. Math Models Methods Appl Sci. 2020. PMID: 35309741 Free PMC article.
-
Modelling hepatitis C therapy--predicting effects of treatment.Nat Rev Gastroenterol Hepatol. 2015 Aug;12(8):437-45. doi: 10.1038/nrgastro.2015.97. Epub 2015 Jun 30. Nat Rev Gastroenterol Hepatol. 2015. PMID: 26122475 Free PMC article. Review.
References
-
- Schneider M, Sarrazin C (2014) Antiviral therapy of hepatitis C in 2014: Do we need resistance testing? Antiviral Res 105: 64–71. - PubMed
-
- Pawlotsky J (2013) Treatment of chronic hepatitis C: current and future. Curr Top Microbiol Immunol 369: 321–342. - PubMed
-
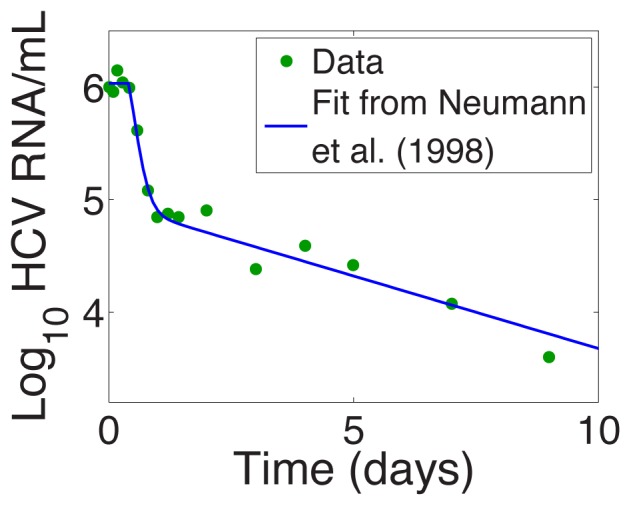
- Neumann AU, Lam NP, Dahari H, Gretch DR, Wiley TE, et al. (1998) Hepatitis C dynamics in vivo and the antiviral efficacy of interferon-α therapy. Science 282: 103–107. - PubMed
-
- Dixit NM, Layden-Almer JE, Layden TJ, Perelson AS (2004) Modelling how ribavirin improves interferon response rates in hepatitis C virus infection. Nature 432: 922–4. - PubMed
-
- Guedj J, Neumann AU (2010) Understanding hepatitis C viral dynamics with direct-acting antiviral agents due to the interplay between intracellular replication and cellular infection dynamics. J Theor Biol 267: 330–40. - PubMed
Publication types
MeSH terms
Substances
Grants and funding
LinkOut - more resources
Full Text Sources
Other Literature Sources
Medical
