

Phenotypic signatures arising from unbalanced bacterial growth
- PMID: 25101949
- PMCID: PMC4125075
- DOI: 10.1371/journal.pcbi.1003751
Phenotypic signatures arising from unbalanced bacterial growth
Abstract
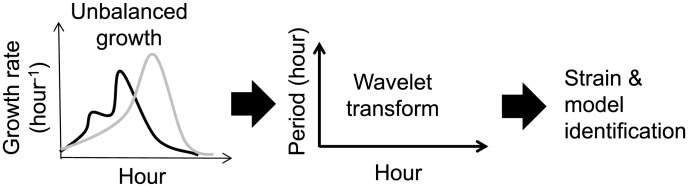
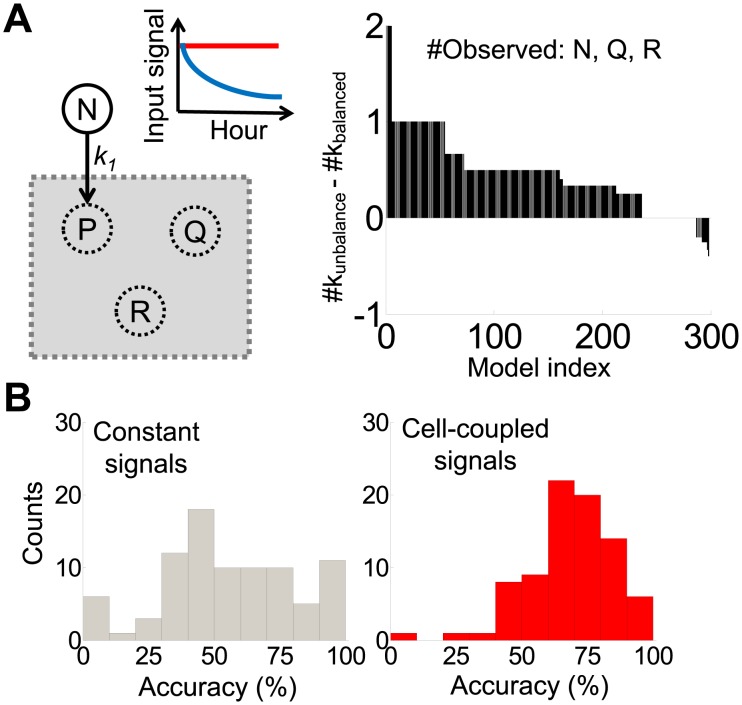
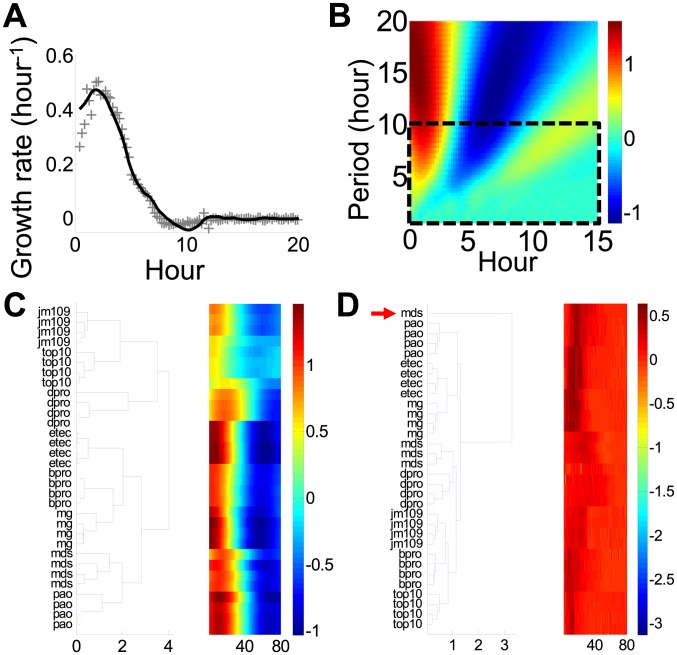
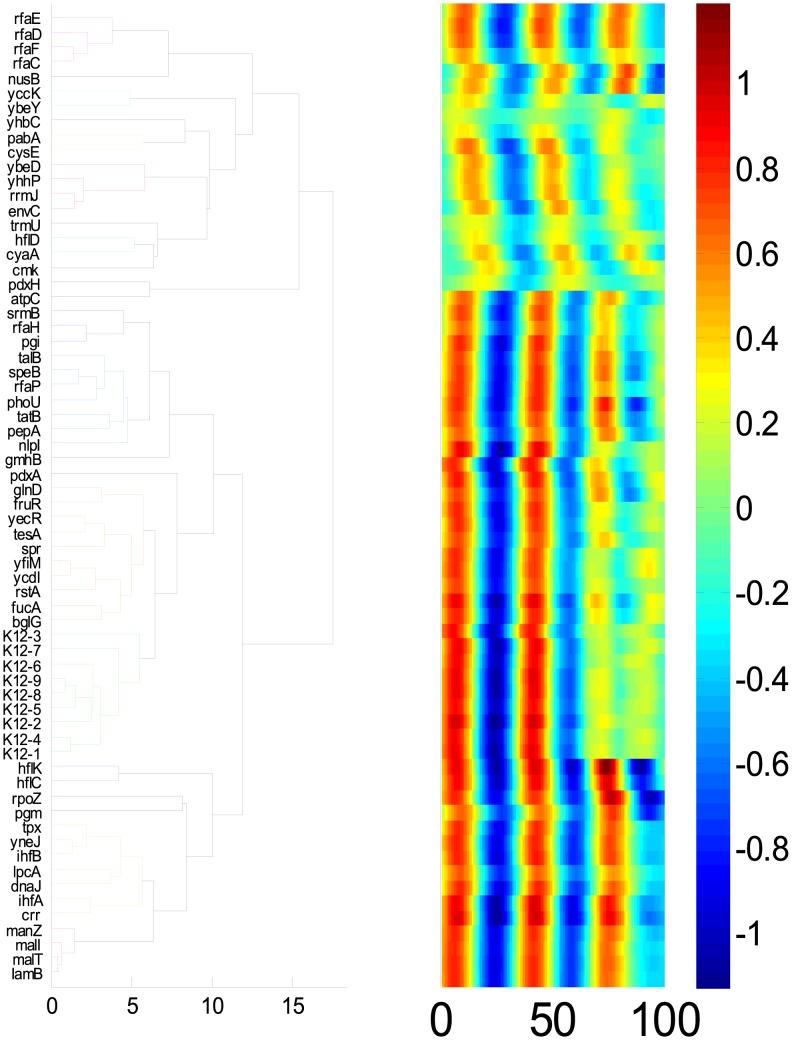
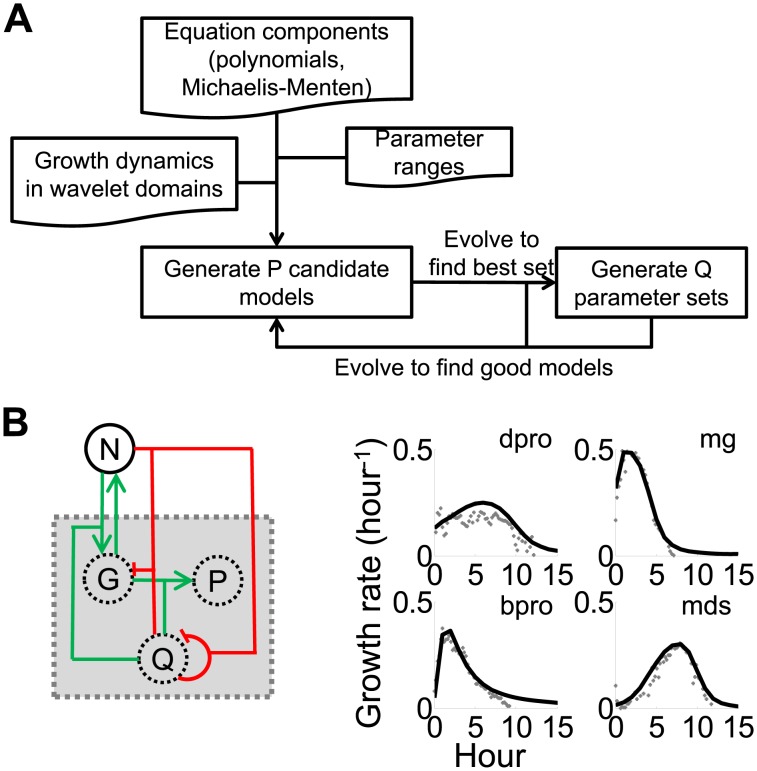
Fluctuations in the growth rate of a bacterial culture during unbalanced growth are generally considered undesirable in quantitative studies of bacterial physiology. Under well-controlled experimental conditions, however, these fluctuations are not random but instead reflect the interplay between intra-cellular networks underlying bacterial growth and the growth environment. Therefore, these fluctuations could be considered quantitative phenotypes of the bacteria under a specific growth condition. Here, we present a method to identify "phenotypic signatures" by time-frequency analysis of unbalanced growth curves measured with high temporal resolution. The signatures are then applied to differentiate amongst different bacterial strains or the same strain under different growth conditions, and to identify the essential architecture of the gene network underlying the observed growth dynamics. Our method has implications for both basic understanding of bacterial physiology and for the classification of bacterial strains.
Conflict of interest statement
The authors have declared that no competing interests exist.
Figures
Similar articles
-
From growth physiology to systems biology.Int Microbiol. 2006 Sep;9(3):157-61. Int Microbiol. 2006. PMID: 17061205 Review.
-
Network-based functional modeling of genomics, transcriptomics and metabolism in bacteria.Curr Opin Microbiol. 2011 Oct;14(5):599-607. doi: 10.1016/j.mib.2011.09.003. Epub 2011 Sep 21. Curr Opin Microbiol. 2011. PMID: 21943683 Review.
-
A Bayesian non-parametric mixed-effects model of microbial growth curves.PLoS Comput Biol. 2020 Oct 26;16(10):e1008366. doi: 10.1371/journal.pcbi.1008366. eCollection 2020 Oct. PLoS Comput Biol. 2020. PMID: 33104703 Free PMC article.
-
Are essential genes really essential?Trends Microbiol. 2009 Oct;17(10):433-8. doi: 10.1016/j.tim.2009.08.005. Epub 2009 Sep 16. Trends Microbiol. 2009. PMID: 19765999
-
Non-transcriptional regulatory processes shape transcriptional network dynamics.Nat Rev Microbiol. 2011 Oct 11;9(11):817-28. doi: 10.1038/nrmicro2667. Nat Rev Microbiol. 2011. PMID: 21986901 Free PMC article. Review.
Cited by
-
Bacterial temporal dynamics enable optimal design of antibiotic treatment.PLoS Comput Biol. 2015 Apr 23;11(4):e1004201. doi: 10.1371/journal.pcbi.1004201. eCollection 2015 Apr. PLoS Comput Biol. 2015. PMID: 25905796 Free PMC article.
-
Autoencoder neural networks enable low dimensional structure analyses of microbial growth dynamics.Nat Commun. 2023 Dec 1;14(1):7937. doi: 10.1038/s41467-023-43455-0. Nat Commun. 2023. PMID: 38049401 Free PMC article.
-
Optimal dose of lactoferrin reduces the resilience of in vitro Staphylococcus aureus colonies.PLoS One. 2022 Aug 12;17(8):e0273088. doi: 10.1371/journal.pone.0273088. eCollection 2022. PLoS One. 2022. PMID: 35960734 Free PMC article.
-
Dynamic control and quantification of bacterial population dynamics in droplets.Biomaterials. 2015 Aug;61:239-45. doi: 10.1016/j.biomaterials.2015.05.038. Epub 2015 May 19. Biomaterials. 2015. PMID: 26005763 Free PMC article.
-
Robust, linear correlations between growth rates and β-lactam-mediated lysis rates.Proc Natl Acad Sci U S A. 2018 Apr 17;115(16):4069-4074. doi: 10.1073/pnas.1719504115. Epub 2018 Apr 2. Proc Natl Acad Sci U S A. 2018. PMID: 29610312 Free PMC article.
References
-
- Monod J (1949) The growth of bacterial cultures. Annu Rev Microbiol 3: 371–394.
-
- Bremer H, Dennis PP (1996) Modulation of chemical composition and other parameters of the cell by growth rate. In: Neidhardt FC, editor. Escherichia coli and Samonella: Cellular and Molecular Biology. 2nd ed. Washington DC: ASM Press. pp. 1553–1569.
-
- Scott M, Gunderson CW, Mateescu EM, Zhang Z, Hwa T (2010) Interdependence of cell growth and gene expression: origins and consequences. Science 330: 1099–1102. - PubMed
-
- Novick A, Szilard L (1950) Description of the chemostat. Science 112: 715–716. - PubMed
Publication types
MeSH terms
Grants and funding
LinkOut - more resources
Full Text Sources
Other Literature Sources
