

A population genetic signal of polygenic adaptation
- PMID: 25102153
- PMCID: PMC4125079
- DOI: 10.1371/journal.pgen.1004412
A population genetic signal of polygenic adaptation
Abstract
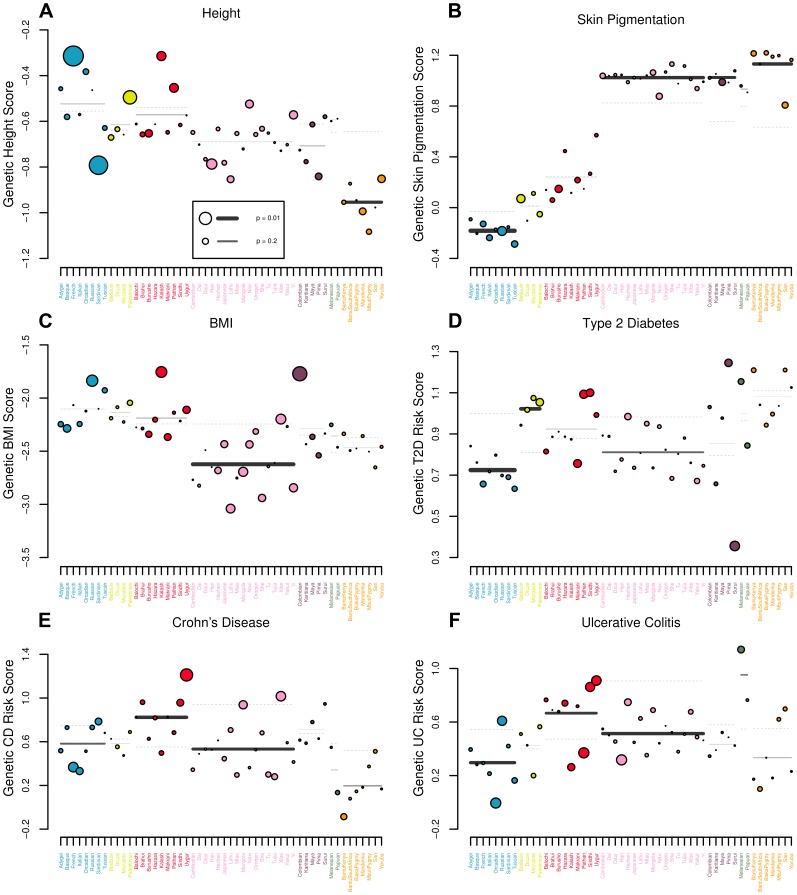
Adaptation in response to selection on polygenic phenotypes may occur via subtle allele frequencies shifts at many loci. Current population genomic techniques are not well posed to identify such signals. In the past decade, detailed knowledge about the specific loci underlying polygenic traits has begun to emerge from genome-wide association studies (GWAS). Here we combine this knowledge from GWAS with robust population genetic modeling to identify traits that may have been influenced by local adaptation. We exploit the fact that GWAS provide an estimate of the additive effect size of many loci to estimate the mean additive genetic value for a given phenotype across many populations as simple weighted sums of allele frequencies. We use a general model of neutral genetic value drift for an arbitrary number of populations with an arbitrary relatedness structure. Based on this model, we develop methods for detecting unusually strong correlations between genetic values and specific environmental variables, as well as a generalization of [Q(ST)/F(ST)] comparisons to test for over-dispersion of genetic values among populations. Finally we lay out a framework to identify the individual populations or groups of populations that contribute to the signal of overdispersion. These tests have considerably greater power than their single locus equivalents due to the fact that they look for positive covariance between like effect alleles, and also significantly outperform methods that do not account for population structure. We apply our tests to the Human Genome Diversity Panel (HGDP) dataset using GWAS data for height, skin pigmentation, type 2 diabetes, body mass index, and two inflammatory bowel disease datasets. This analysis uncovers a number of putative signals of local adaptation, and we discuss the biological interpretation and caveats of these results.
Conflict of interest statement
The authors have declared that no competing interests exist.
Figures
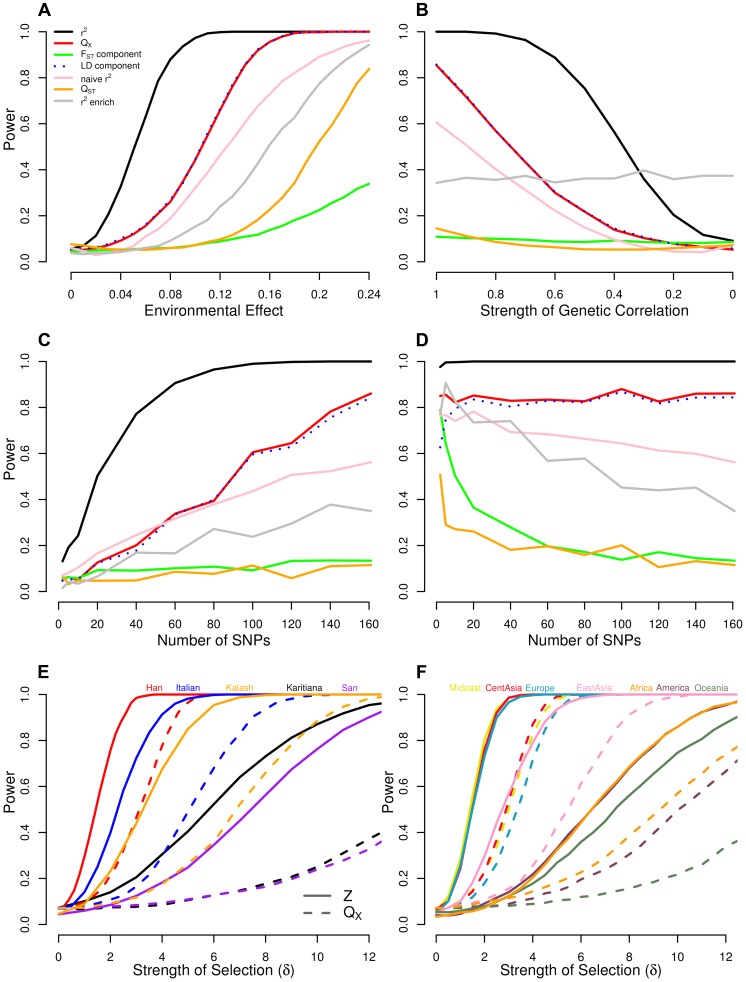
 ) of latitude, and when we hold
  constant at 0.14 and (B) decrease
  , the genetic correlation between the trait of interest and the selected trait, (C) vary the number of loci, and (D) vary the number of loci while holding the fraction of variance explained constant. Bottom panels show power of the Z-test and
  approaches to detect selection affecting (E) a single population, and (F) multiple populations in a given region. See main text for simulation details.
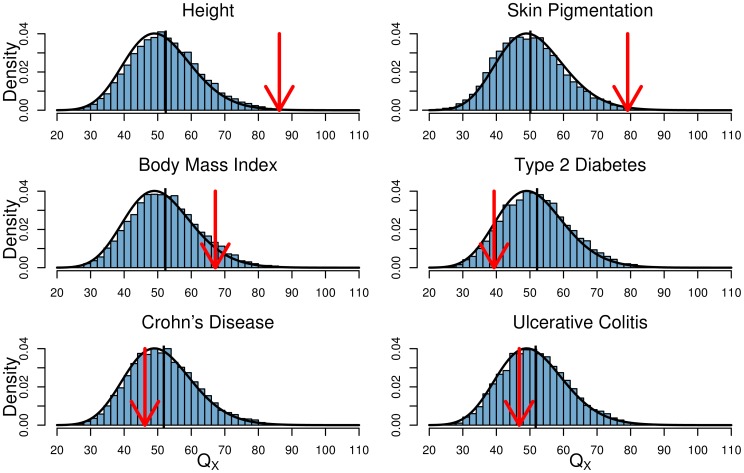
 density is shown as a black curve.
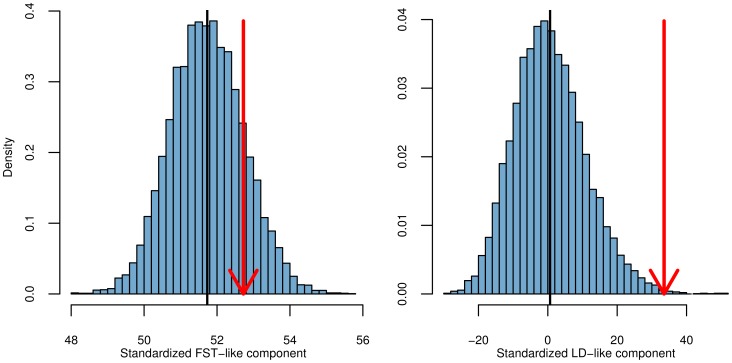
References
-
- Fisher RA (1918) XV.—The Correlation between Relatives on the Supposition of Mendelian Inheritance. Transactions of the Royal Society of Edinburgh 52: 399–433.
-
- Provine WB (2001) The Origins of Theoretical Population Genetics. With a New Afterword. University Of Chicago Press.
-
- Turelli M, Barton NH (1990) Dynamics of polygenic characters under selection. Theoretical Population Biology 38: 1–57.
-
- Slate J (2005) Quantitative trait locus mapping in natural populations: progress, caveats and future directions. Molecular Ecology 14: 363–379. - PubMed
-
- Kingsolver JG, Hoekstra HE, Hoekstra JM, Berrigan D, Vignieri SN, et al. (2001) The Strength of Phenotypic Selection in Natural Populations. The American Naturalist 157: 245–261. - PubMed
Publication types
MeSH terms
Grants and funding
LinkOut - more resources
Full Text Sources
Other Literature Sources
Miscellaneous
