

SciClone: inferring clonal architecture and tracking the spatial and temporal patterns of tumor evolution
- PMID: 25102416
- PMCID: PMC4125065
- DOI: 10.1371/journal.pcbi.1003665
SciClone: inferring clonal architecture and tracking the spatial and temporal patterns of tumor evolution
Abstract
The sensitivity of massively-parallel sequencing has confirmed that most cancers are oligoclonal, with subpopulations of neoplastic cells harboring distinct mutations. A fine resolution view of this clonal architecture provides insight into tumor heterogeneity, evolution, and treatment response, all of which may have clinical implications. Single tumor analysis already contributes to understanding these phenomena. However, cryptic subclones are frequently revealed by additional patient samples (e.g., collected at relapse or following treatment), indicating that accurately characterizing a tumor requires analyzing multiple samples from the same patient. To address this need, we present SciClone, a computational method that identifies the number and genetic composition of subclones by analyzing the variant allele frequencies of somatic mutations. We use it to detect subclones in acute myeloid leukemia and breast cancer samples that, though present at disease onset, are not evident from a single primary tumor sample. By doing so, we can track tumor evolution and identify the spatial origins of cells resisting therapy.
Conflict of interest statement
The authors have declared that no competing interests exist.
Figures
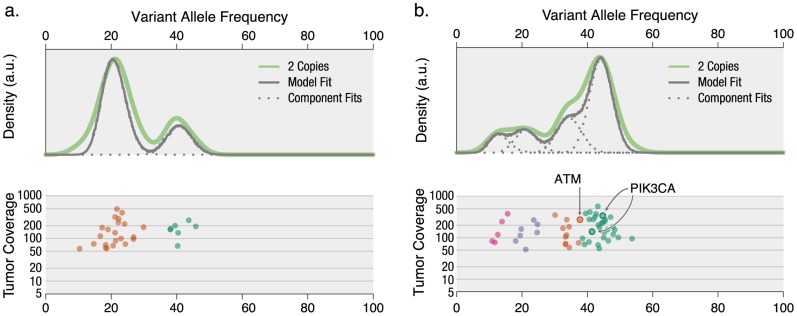
 93%), whereas the clonal context of an ATM mutation is more ambiguous (57.8%).
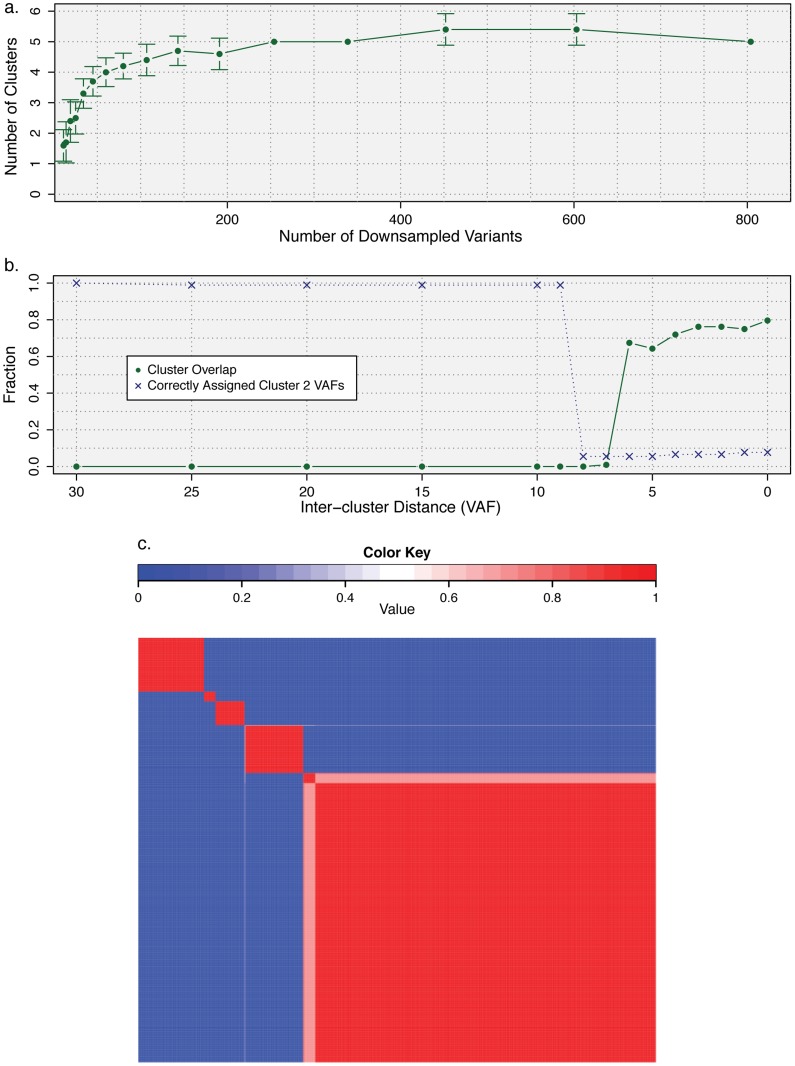
 ). (b) Mutations from clusters one and two from the AML relapse sample were used to assess the limits of cluster separability. As the distance between the two mutation groups was varied, the resulting clusters were assessed for overlap (the fraction of the data within a single standard deviation of both clusters) and accuracy (the fraction of items that were correctly assigned to a second cluster). (c) Consensus clustering of the AML data set (Fig. 3) for number of initial clusters varied from six to 15 and clustering method varied across beta, Gaussian, and binomial mixture models for a total of 30 runs.
  consensus matrix holds all
  variants across both rows and columns and has been reordered so that variants belonging to the same cluster are adjacent to one another. Matrix entry
  ,
,  is the fraction of runs in which variant
  and
and  were co-clustered; entry
  corresponds to the top-left of the matrix heat map. The narrowest neutral-colored band corresponds to a single variant alternatively classified by Gaussian mixture modeling (Fig. S2a). The larger neutral-colored band corresponds to variants alternatively classified as a sixth cluster by binomial mixture modeling (Fig. S2b).
References
-
- Nowell PC (1976) The clonal evolution of tumor cell populations. Science 194: 23–8. - PubMed
Publication types
MeSH terms
Grants and funding
LinkOut - more resources
Full Text Sources
Other Literature Sources
