. 2014 Sep 3;136(35):12489-97.
doi: 10.1021/ja507382j. Epub 2014 Aug 18.

Rapid proton-detected NMR assignment for proteins with fast magic angle spinning

Affiliations

Rapid proton-detected NMR assignment for proteins with fast magic angle spinning

Emeline Barbet-Massin et al. J Am Chem Soc. .

Abstract

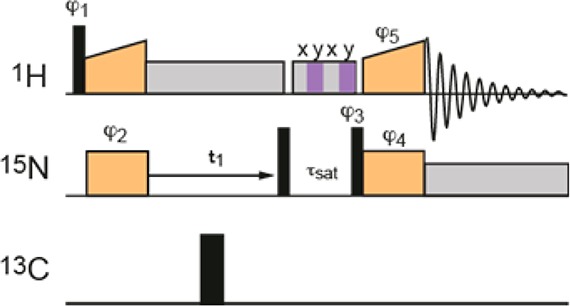
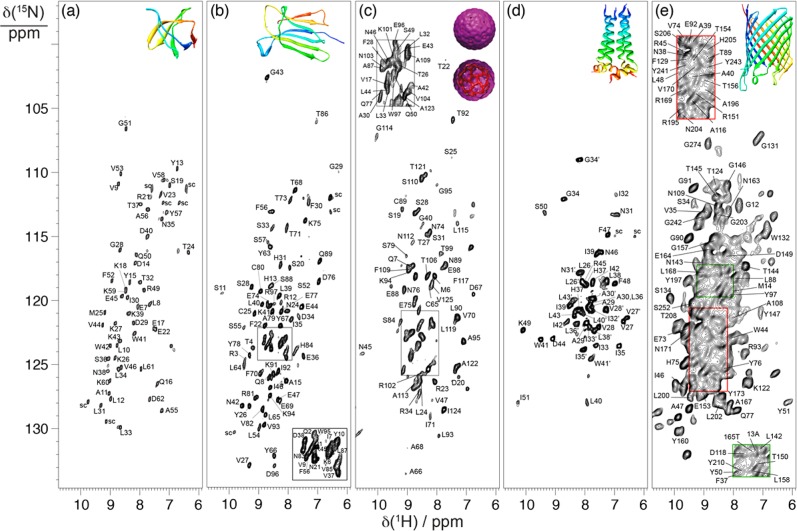
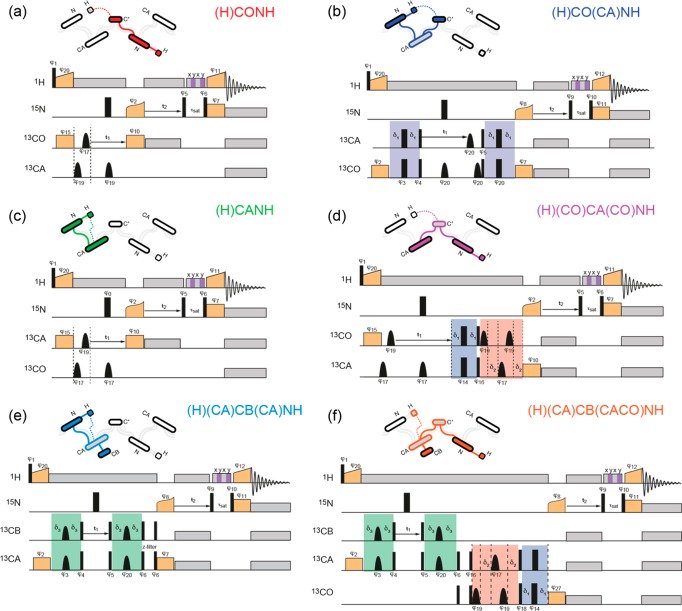
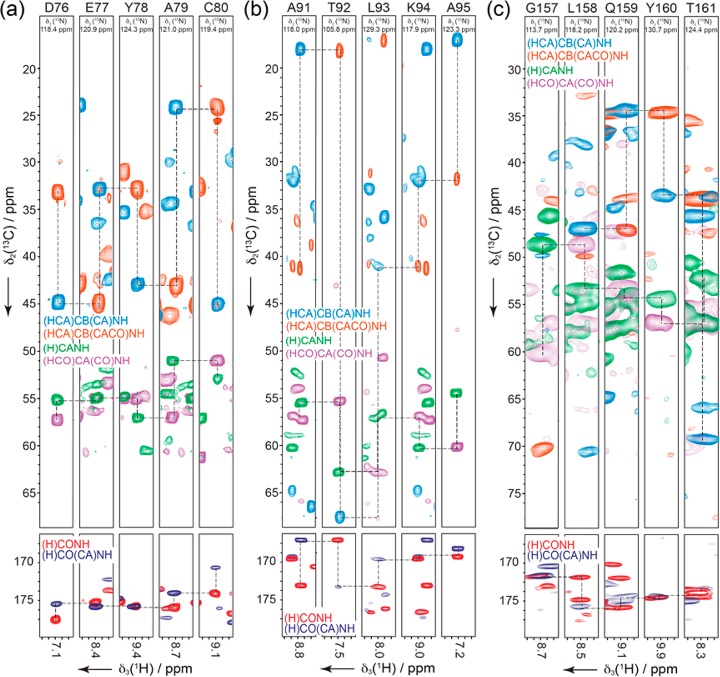
Using a set of six (1)H-detected triple-resonance NMR experiments, we establish a method for sequence-specific backbone resonance assignment of magic angle spinning (MAS) nuclear magnetic resonance (NMR) spectra of 5-30 kDa proteins. The approach relies on perdeuteration, amide (2)H/(1)H exchange, high magnetic fields, and high-spinning frequencies (ωr/2π ≥ 60 kHz) and yields high-quality NMR data, enabling the use of automated analysis. The method is validated with five examples of proteins in different condensed states, including two microcrystalline proteins, a sedimented virus capsid, and two membrane-embedded systems. In comparison to contemporary (13)C/(15)N-based methods, this approach facilitates and accelerates the MAS NMR assignment process, shortening the spectral acquisition times and enabling the use of unsupervised state-of-the-art computational data analysis protocols originally developed for solution NMR.


Figures

Figure 1
Figure 1
Pulse sequence for the 1H-detected 15N–1H 2D correlation (“CP-HSQC”). Narrow and broad black rectangles indicate π/2 and π-pulses, respectively. Orange boxes indicate cross-polarization, and gray boxes indicate heteronuclear decoupling. The MISSISSIPPI sequence is indicated by the striped box. All pulses are of phases 0, unless indicated differently. φ1 = 1 3, φ2 = 1, φ3 = 0 0 2 2, φ4 = 1, φ5 = {1}*4 {3}*4, φrec = 1 3 3 1 3 1 1 3.
Figure 2
Figure 2
15N–1H correlation spectra recorded on a 1 GHz spectrometer under 60 kHz MAS for [U-HN,2H,13C,15N]-labeled (a) microcrystalline SH3, (b) microcrystalline β2m, and (c) sedimented nucleocapsids of AP205, (d) M2 channel, and (e) OmpG.
Figure 3
Figure 3
Pulse sequences for the six 1H-detected 13C–15N–1H 3D correlation experiments, with an illustration of the coherence transfers and spins involved: (a) inter-residue (H)CONH experiment (COi-1NiHi), (b) intraresidue (H)CO(CA)NH experiment (COiNiHi), (c) intraresidue (H)CANH experiment (CAiNiHi), (d) inter-residue (H)(CO)CA(CO)NH experiment (CAi-1NiHi), (e) intraresidue (H)(CA)CB(CA)NH experiment (CBiNiHi), and (f) inter-residue (H)(CA)CB(CACO)NH experiment (CBi-1NiHi). Narrow and broad black rectangles indicate π/2 and π pulses, respectively, and bell shapes represent selective inversion pulses. Orange boxes indicate cross-polarization, and gray boxes indicate heteronuclear decoupling. The MISSISSIPPI sequence is indicated by the striped box. Spin-echoes involved in the transfer between CO and CA are highlighted in blue and red, when the coherence is present on the CO and CA, respectively, and spin-echoes involved in transfer between CA and CB are highlighted in green. All pulses are of phases 0, unless indicated differently. (a and c) φ1 = 0 2, φ20 = 1, φ2 = 1, φ6 = 0 0 2 2, φ12 = 1, φ7 = 1, φ11 = {1}*4 {3}*4, φrec = 1 3 3 1 3 1 1 3; (b) φ1 = 0 2, φ20 = 1, φ2 = 1, φ6 = 0 0 2 2, φ12 = 1, φ7 = 1, φ11 = 1, φ14 = {0}*4 {1}*4, φ17 = {0}*8 {1}*8, φrec = 3 1 1 3 1 3 3 1 1 3 3 1 3 1 1 3; (d and e) φ1 = 1 3, φ2 = 1 1 3 3, φ4 = 1, φ5 = 1, φ7 = {1}*4 {3}*4, φ8 = {0}*8 {2}*8, φ9 = 3, φ10 = 1, φrec = 0 2 2 0 2 0 0 2 2 0 0 2 0 2 2 0; (f) φ1 = 1 3, φ2 = 1 1 3 3, φ4 = 1, φ5 = 1, φ6 = {0}*16 {2}*16, φ9 = 3, φ10 = 1, φ14 = {0}*8 {1}*8, φ16 = 3, φ17 = {0}*4 {1}*4, φrec = 0 2 2 0 2 0 0 2 2 0 0 2 0 2 2 0 2 0 0 2 0 2 2 0 0 2 2 0 2 0 0 2. Specific CP to or from 13C may require a frequency shift, and in this case, the phases of rf during the two 13C CP periods are aligned respectively at the end and at the beginning of the contact time. In the diagrams, filled circles denote spins for which the frequency of evolution is measured. Solid lines represent transfers between bonded nuclei and dashed lines between nonbonded nuclei.
Figure 4
Figure 4
Strip plots of both inter- and intraresidue CB, CA, and CO resonances for NH pairs in β2m (a), AP205 (b), and OmpG (c).

References

    1. Castellani F.; van Rossum B.; Diehl A.; Schubert M.; Rehbein K.; Oschkinat H. Nature 2002, 420, 98–102. - PubMed
    1. Rienstra C. M.; Tucker-Kellogg L.; Jaroniec C. P.; Hohwy M.; Reif B.; McMahon M. T.; Tidor B.; Lozano-Perez T.; Griffin R. G. Proc. Natl. Acad. Sci. U. S. A. 2002, 99, 10260–10265. - PMC - PubMed
    1. Wasmer C.; Lange A.; Van Melckebeke H.; Siemer A. B.; Riek R.; Meier B. H. Science 2008, 319, 1523–1526. - PubMed
    1. Lu J. X.; Qiang W.; Yau W. M.; Schwieters C. D.; Meredith S. C.; Tycko R. Cell 2013, 154, 1257–1268. - PMC - PubMed
    1. Jehle S.; Rajagopal P.; Bardiaux B.; Markovic S.; Kuhne R.; Stout J. R.; Higman V. A.; Klevit R. E.; van Rossum B. J.; Oschkinat H. Nat. Struct. Mol. Biol. 2010, 17, 1037–1042. - PMC - PubMed

Publication types

LinkOut - more resources