

The homeostatic set point of the hypothalamus-pituitary-thyroid axis--maximum curvature theory for personalized euthyroid targets
- PMID: 25102854
- PMCID: PMC4237899
- DOI: 10.1186/1742-4682-11-35
The homeostatic set point of the hypothalamus-pituitary-thyroid axis--maximum curvature theory for personalized euthyroid targets
Abstract
Background: Despite rendering serum free thyroxine (FT4) and thyrotropin (TSH) within the normal population ranges broadly defined as euthyroidism, many patients being treated for hyperthyroidism and hypothyroidism persistently experience subnormal well-being discordant from their pre-disease healthy euthyroid state. This suggests that intra-individual physiological optimal ranges are narrower than laboratory-quoted normal ranges and implies the existence of a homeostatic set point encoded in the hypothalamic-pituitary-thyroid (HPT) axis that is unique to every individual.
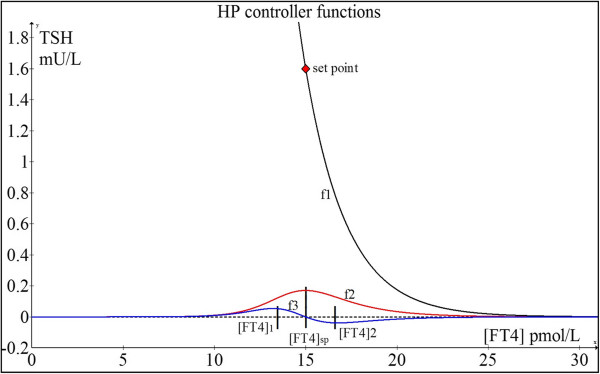
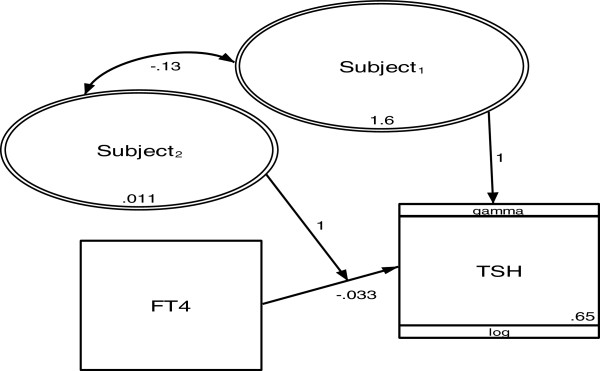
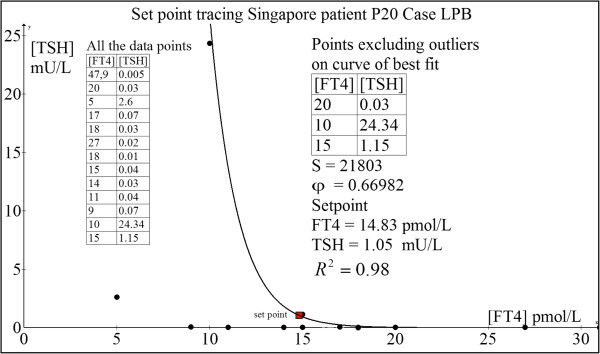
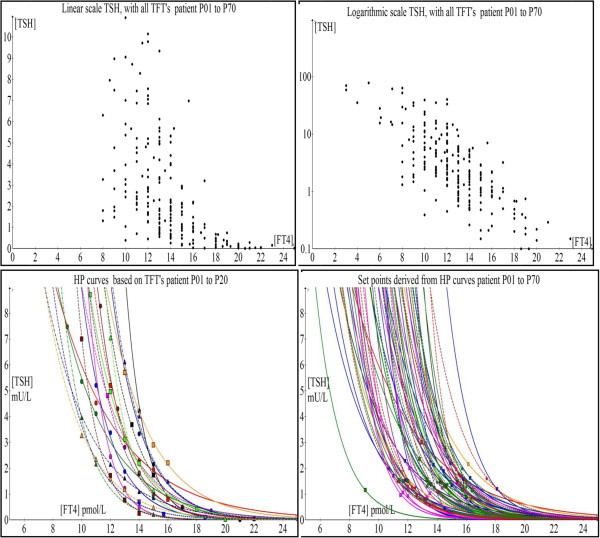
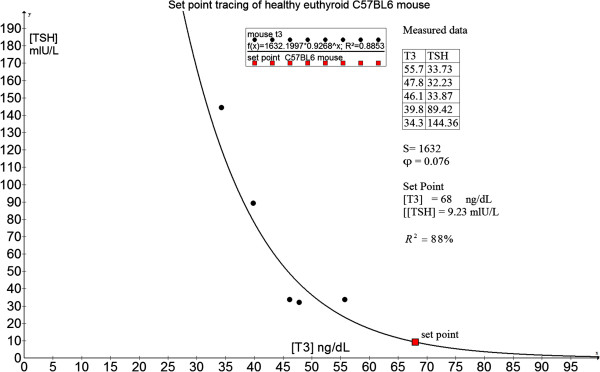
Methods: We have previously shown that the dose-response characteristic of the hypothalamic-pituitary (HP) unit to circulating thyroid hormone levels follows a negative exponential curve. This led to the discovery that the normal reference intervals of TSH and FT4 fall within the 'knee' region of this curve where the maximum curvature of the exponential HP characteristic occurs. Based on this observation, we develop the theoretical framework localizing the position of euthyroid homeostasis over the point of maximum curvature of the HP characteristic.
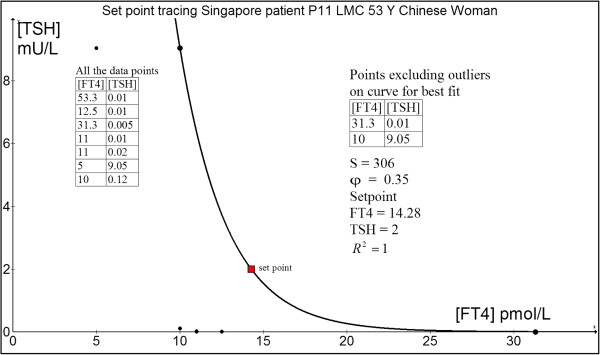
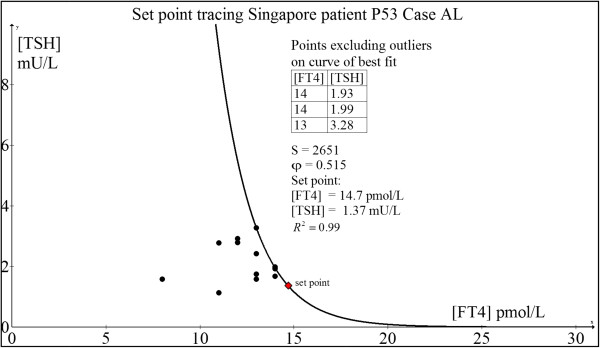
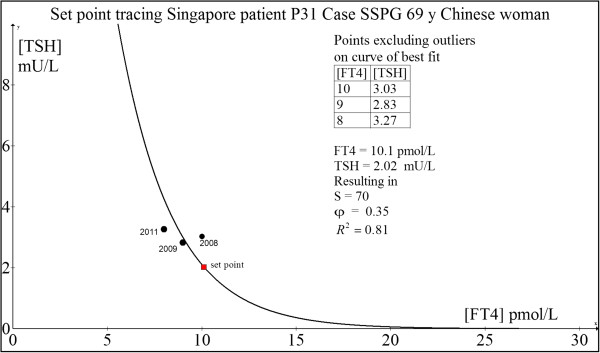
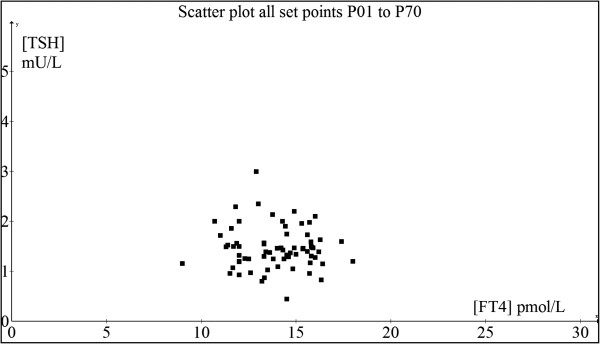
Results: The euthyroid set points of patients with primary hypothyroidism and hyperthyroidism can be readily derived from their calculated HP curve parameters using the parsimonious mathematical model above. It can be shown that every individual has a euthyroid set point that is unique and often different from other individuals.
Conclusions: In this treatise, we provide evidence supporting a set point-based approach in tailoring euthyroid targets. Rendering FT4 and TSH within the laboratory normal ranges can be clinically suboptimal if these hormone levels are distant from the individualized euthyroid homeostatic set point. This mathematical technique permits the euthyroid set point to be realistically computed using an algorithm readily implementable for computer-aided calculations to facilitate precise targeted dosing of patients in this modern era of personalized medicine.
Figures
Similar articles
-
Profiling retrospective thyroid function data in complete thyroidectomy patients to investigate the HPT axis set point (PREDICT-IT).J Endocrinol Invest. 2021 May;44(5):969-977. doi: 10.1007/s40618-020-01390-7. Epub 2020 Aug 17. J Endocrinol Invest. 2021. PMID: 32808162
-
The Effects of Triiodothyronine on the Free Thyroxine Set Point Position in the Hypothalamus Pituitary Thyroid Axis.Acta Biotheor. 2024 Aug 29;72(3):10. doi: 10.1007/s10441-024-09486-w. Acta Biotheor. 2024. PMID: 39207534
-
A novel minimal mathematical model of the hypothalamus-pituitary-thyroid axis validated for individualized clinical applications.Math Biosci. 2014 Mar;249:1-7. doi: 10.1016/j.mbs.2014.01.001. Epub 2014 Jan 28. Math Biosci. 2014. PMID: 24480737
-
The hypothalamic-pituitary-thyroid axis.Med Clin North Am. 1975 Sep;59(5):1045-53. doi: 10.1016/s0025-7125(16)31955-1. Med Clin North Am. 1975. PMID: 808671 Review.
-
Thyroid function in the elderly.Am J Med Sci. 1982 Jan-Feb;283(1):8-17. doi: 10.1097/00000441-198201000-00002. Am J Med Sci. 1982. PMID: 6798870 Review.
Cited by
-
Liganded T3 receptor β2 inhibits the positive feedback autoregulation of the gene for GATA2, a transcription factor critical for thyrotropin production.PLoS One. 2020 Jan 15;15(1):e0227646. doi: 10.1371/journal.pone.0227646. eCollection 2020. PLoS One. 2020. PMID: 31940421 Free PMC article.
-
Reinterpreting patterns of variation in human thyroid function: An evolutionary ecology perspective.Evol Med Public Health. 2020 Nov 10;9(1):93-112. doi: 10.1093/emph/eoaa043. eCollection 2021. Evol Med Public Health. 2020. PMID: 34557302 Free PMC article. Review.
-
Challenges in Interpreting Thyroid Stimulating Hormone Results in the Diagnosis of Thyroid Dysfunction.J Thyroid Res. 2019 Sep 22;2019:4106816. doi: 10.1155/2019/4106816. eCollection 2019. J Thyroid Res. 2019. PMID: 31662841 Free PMC article. Review.
-
The Relationship between Population T4/TSH Set Point Data and T4/TSH Physiology.J Thyroid Res. 2016;2016:6351473. doi: 10.1155/2016/6351473. Epub 2016 Mar 31. J Thyroid Res. 2016. PMID: 27123359 Free PMC article.
-
Mathematical Modeling of the Pituitary-Thyroid Feedback Loop: Role of a TSH-T3-Shunt and Sensitivity Analysis.Front Endocrinol (Lausanne). 2018 Mar 21;9:91. doi: 10.3389/fendo.2018.00091. eCollection 2018. Front Endocrinol (Lausanne). 2018. PMID: 29619006 Free PMC article.
References
-
- Lambrinoudaki I, Armeni E, Rizos D, Georgiopoulos G, Kazani M, Alexandrou A, Deligeoroglou E, Livada A, Psychas C, Creatsa M, Bouboulis G, Alevizaki M, Stamatelopoulos K. High normal thyroid-stimulating hormone is associated with arterial stiffness in healthy postmenopausal women. J Hypertens. 2012;30:592–599. doi: 10.1097/HJH.0b013e32834f5076. - DOI - PubMed
-
- Hamilton TE, Davis S, Onstad L, Kopecky KJ. Thyrotropin levels in a population with no clinical, autoantibody, or ultrasonographic evidence of thyroid disease: implications for the diagnosis of subclinical hypothyroidism. J Clin Endocrinol Metab. 2008;93:1224–1230. doi: 10.1210/jc.2006-2300. - DOI - PMC - PubMed
Publication types
MeSH terms
Substances
LinkOut - more resources
Full Text Sources
Other Literature Sources
Medical
Research Materials
Miscellaneous
