

Common genetic variation in and near the melanocortin 4 receptor gene (MC4R) is associated with body mass index in American Indian adults and children
- PMID: 25103139
- PMCID: PMC4185108
- DOI: 10.1007/s00439-014-1477-6
Common genetic variation in and near the melanocortin 4 receptor gene (MC4R) is associated with body mass index in American Indian adults and children
Abstract
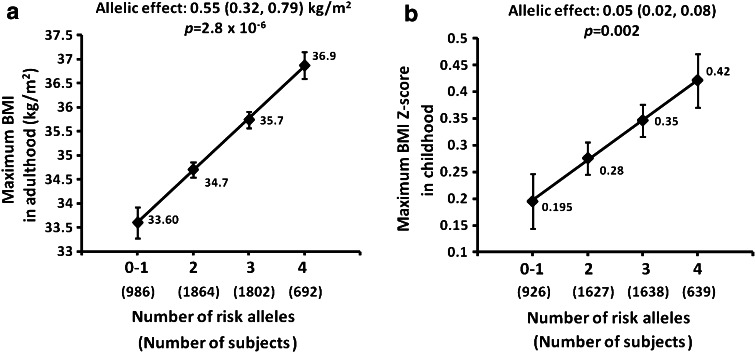
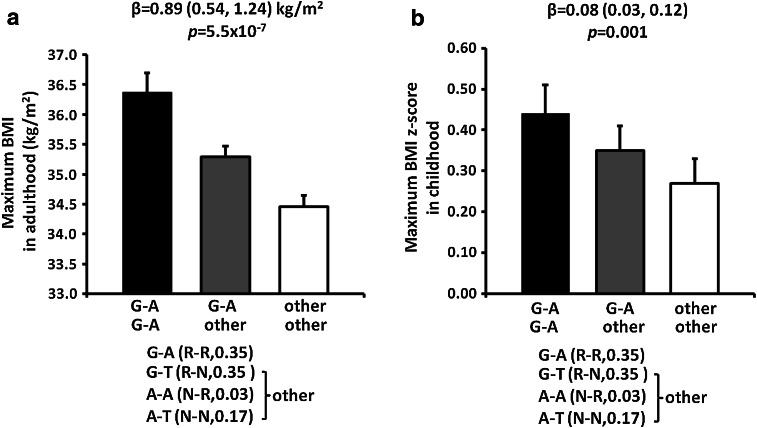
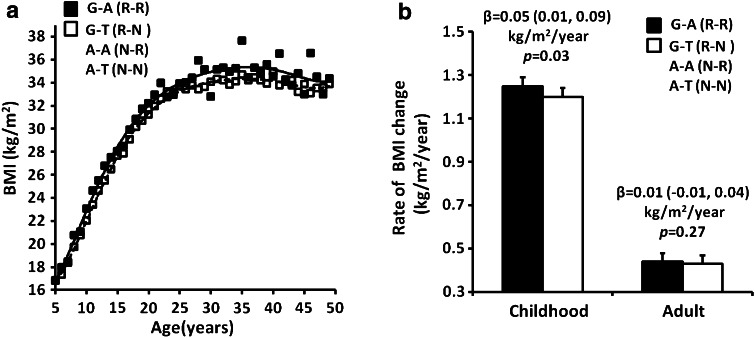
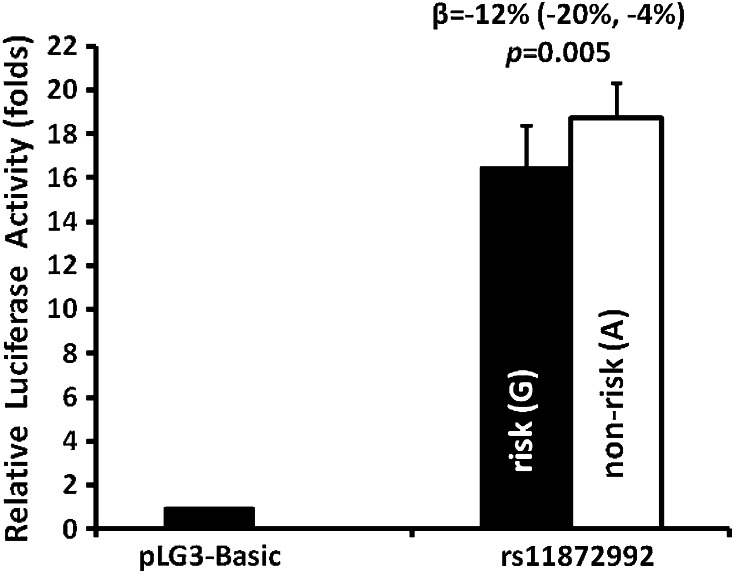
Six rare functional coding mutations were previously identified in melanocortin 4 receptor (MC4R) in 6,760 American Indians. Individuals heterozygous for one of these mutations become obese while young. We now investigate whether common non-coding variation near MC4R also contributes to obesity. Fifty-six tag single-nucleotide polymorphisms (SNPs) were genotyped in 3,229 full-heritage Pima Indians, and nine of these SNPs which showed evidence for association were genotyped in additional 3,852 mixed-heritage American Indians. Associations of SNPs with maximum body mass index (BMI) in adulthood (n = 5,918), BMI z score in childhood (n = 5,350), percent body fat (n = 864), energy expenditure (n = 358) and ad libitum food intake (n = 178) were assessed. Conditional analyses demonstrated that SNPs, rs74861148 and rs483125, were independently associated with BMI in adulthood (β = 0.68 kg/m(2) per risk allele, p = 5 × 10(-5); β = 0.58 kg/m(2), p = 0.002, respectively) and BMI z score in childhood (β = 0.05, p = 0.02; β = 0.07, p = 0.01, respectively). One haplotype (frequency = 0.35) of the G allele at rs74861148 and the A allele at rs483125 provided the strongest evidence for association with adult BMI (β = 0.89 kg/m(2), p = 5.5 × 10(-7)), and was also associated with childhood BMI z score (β = 0.08, p = 0.001). In addition, a promoter SNP rs11872992 was nominally associated with adult BMI (β = 0.61 kg/m(2), p = 0.05) and childhood BMI z score (β = 0.11, p = 0.01), where the risk allele also modestly decreased transcription in vitro by 12 % (p = 0.005). This risk allele was further associated with increased percent body fat (β = 2.2 %, p = 0.002), increased food intake (β = 676 kcal/day, p = 0.007) and decreased energy expenditure (β = -53.4 kcal/day, p = 0.054). Common and rare variation in MC4R contributes to obesity in American Indians.
Figures
References
-
- Calton MA, Ersoy BA, Zhang S, Kane JP, Malloy MJ, Pullinger CR, et al. Association of functionally significant Melanocortin-4 but not Melanocortin-3 receptor mutations with severe adult obesity in a large North American case-control study. Hum Mol Genet. 2009;18:1140–1147. doi: 10.1093/hmg/ddn431. - DOI - PMC - PubMed
Publication types
MeSH terms
Substances
Grants and funding
LinkOut - more resources
Full Text Sources
Other Literature Sources
Medical
