A prospective longitudinal study of retinal structure and function in achromatopsia
- PMID: 25103266
- PMCID: PMC4161486
- DOI: 10.1167/iovs.14-14937
A prospective longitudinal study of retinal structure and function in achromatopsia
Abstract
Purpose: To longitudinally characterize retinal structure and function in achromatopsia (ACHM) in preparation for clinical gene therapy trials.
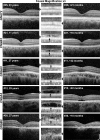
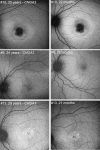
Methods: Thirty-eight molecularly confirmed ACHM subjects underwent serial assessments, including spectral domain optical coherence tomography (SD-OCT), microperimetry, and fundus autofluorescence (FAF). Foveal structure on SD-OCT was graded and compared for evidence of progression, along with serial measurements of foveal total retinal thickness (FTRT) and outer nuclear layer (ONL) thickness. Fundus autofluorescence patterns were characterized and compared over time.
Results: Mean follow-up was 19.5 months (age range at baseline, 6-52 years). Only 2 (5%) of 37 subjects demonstrated change in serial foveal SD-OCT scans. There was no statistically significant change over time in FTRT (P = 0.83), ONL thickness (P = 0.27), hyporeflective zone diameter (P = 0.42), visual acuity (P = 0.89), contrast sensitivity (P = 0.22), mean retinal sensitivity (P = 0.84), and fixation stability (P = 0.58). Three distinct FAF patterns were observed (n = 30): central increased FAF (n = 4), normal FAF (n = 11), and well-demarcated reduced FAF (n = 15); with the latter group displaying a slow increase in the area of reduced FAF of 0.03 mm(2) over 19.3 months (P = 0.002).
Conclusions: Previously published cross-sectional studies have described conflicting findings with respect to the age-dependency of progression. This study, which constitutes the largest and longest prospective longitudinal study of ACHM to date, suggests that although ACHM may be progressive, any such progression is slow and subtle in most patients, and does not correlate with age or genotype. We also describe the first serial assessment of FAF, which is highly variable between individuals, even of similar age and genotype.
Keywords: achromatopsia; gene therapy; optical coherence tomography; retinal degeneration; retinal dystrophy.
Copyright 2014 The Association for Research in Vision and Ophthalmology, Inc.
Figures


References
-
- Andréasson S, Tornqvist K. Electroretinograms in patients with achromatopsia. Acta Ophthalmol (Copenh). 1991; 69: 711–716 - PubMed
-
- Khan NW, Wissinger B, Kohl S, Sieving PA. CNGB3 achromatopsia with progressive loss of residual cone function and impaired rod-mediated function. Invest Ophthalmol Vis Sci. 2007; 48: 3864–3871 - PubMed
-
- Wissinger B, Jägle H, Kohl S, et al. Human rod monochromacy: linkage analysis and mapping of a cone photoreceptor expressed candidate gene on chromosome 2q11. Genomics. 1998; 51: 325–331 - PubMed
Publication types
MeSH terms
Grants and funding
LinkOut - more resources
Full Text Sources
Other Literature Sources
Medical

