

Proteomics analysis reveals protein expression differences for hypopharyngeal gland activity in the honeybee, Apis mellifera carnica Pollmann
- PMID: 25103401
- PMCID: PMC4141115
- DOI: 10.1186/1471-2164-15-665
Proteomics analysis reveals protein expression differences for hypopharyngeal gland activity in the honeybee, Apis mellifera carnica Pollmann
Abstract
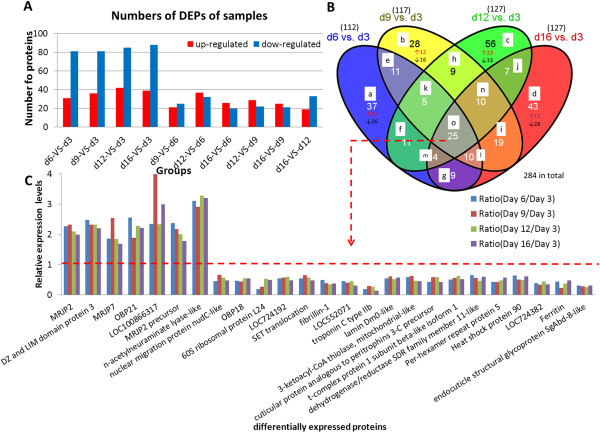
Background: Most of the proteins contained in royal jelly (RJ) are secreted from the hypopharyngeal glands (HG) of young bees. Although generic protein composition of RJ has been investigated, little is known about how age-dependent changes on HG secretion affect RJ composition and their biological consequences. In this study, we identified differentially expressed proteins (DEPs) during HG development by using the isobaric tag for relative and absolute quantification (iTRAQ) labeling technique. This proteomic method increases the potential for new protein discovery by improving the identification of low quantity proteins.
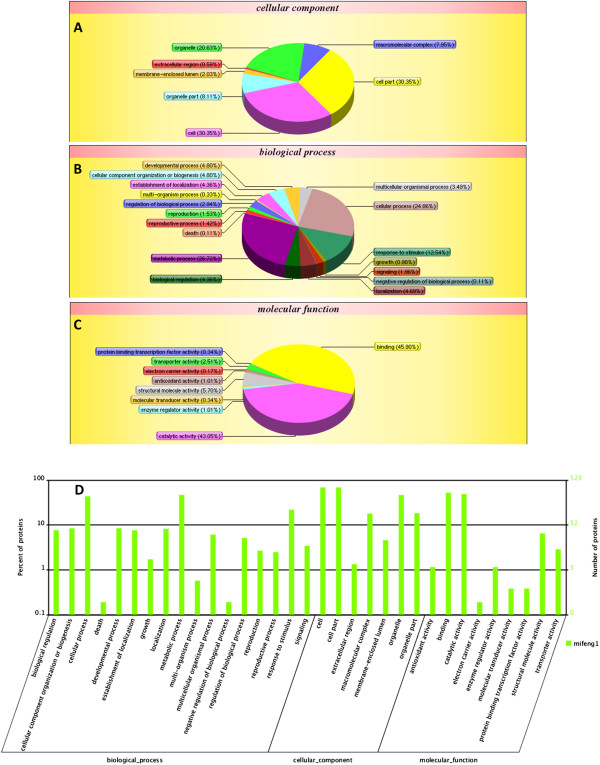
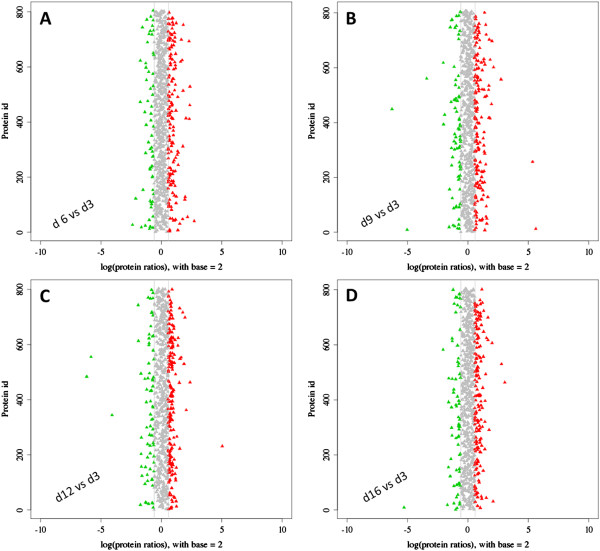
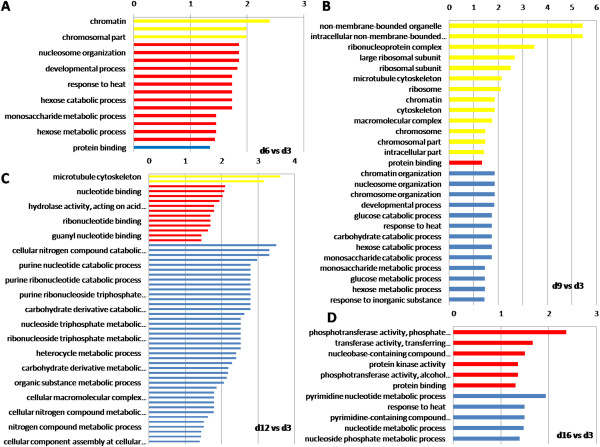
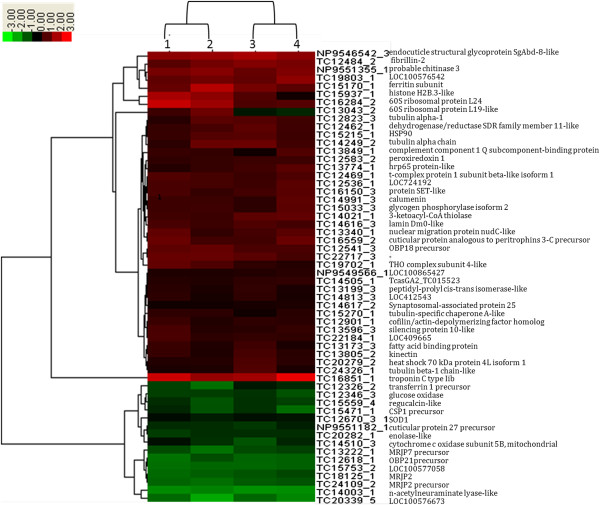
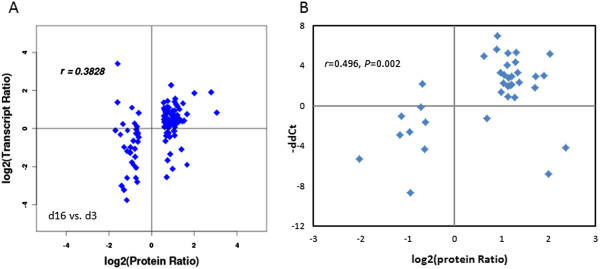
Results: A total of 1282 proteins were identified from five age groups of worker bees, 284 of which were differentially expressed. 43 (15.1%) of the DEPs were identified for the first time. Comparison of samples at day 6, 9, 12, and 16 of development relative to day 3 led to the unambiguous identification of 112, 117, 127, and 127 DEPs, respectively. The majority of these DEPs were up-regulated in the older worker groups, indicating a substantial change in the pattern of proteins expressed after 3 days. DEPs were identified among all the age groups, suggesting that changes in protein expression during HG ontogeny are concomitant with different states of worker development. A total of 649 proteins were mapped to canonical signaling pathways found in the Kyoto Encyclopedia of Genes and Genomes (KEGG), which were preferentially associated with metabolism and biosynthesis of secondary metabolites. More than 10 key high-abundance proteins were involved in signaling pathways related to ribosome function and protein processing in the endoplasmic reticulum. The results were validated by qPCR.
Conclusion: Our approach demonstrates that HG experienced important changes in protein expression during its ontogenic development, which supports the secretion of proteins involved in diverse functions in adult workers beyond its traditional role in royal jelly production.
Figures
Similar articles
-
Proteome comparison of hypopharyngeal gland development between Italian and royal jelly producing worker honeybees (Apis mellifera L.).J Proteome Res. 2010 Dec 3;9(12):6578-94. doi: 10.1021/pr100768t. Epub 2010 Oct 22. J Proteome Res. 2010. PMID: 20882974
-
Phosphoproteomic Analysis of Protein Phosphorylation Networks in the Hypopharyngeal Gland of Honeybee Workers (Apis mellifera ligustica).J Proteome Res. 2015 Nov 6;14(11):4647-61. doi: 10.1021/acs.jproteome.5b00530. Epub 2015 Sep 25. J Proteome Res. 2015. PMID: 26384081
-
Transcriptome differences in the hypopharyngeal gland between Western Honeybees (Apis mellifera) and Eastern Honeybees (Apis cerana).BMC Genomics. 2014 Aug 30;15(1):744. doi: 10.1186/1471-2164-15-744. BMC Genomics. 2014. PMID: 25174638 Free PMC article.
-
Origin and function of the major royal jelly proteins of the honeybee (Apis mellifera) as members of the yellow gene family.Biol Rev Camb Philos Soc. 2014 May;89(2):255-69. doi: 10.1111/brv.12052. Epub 2013 Jul 16. Biol Rev Camb Philos Soc. 2014. PMID: 23855350 Review.
-
[Royal jelly: component efficiency, analysis, and standardisation].Arh Hig Rada Toksikol. 2013 Sep;64(3):445-61. doi: 10.2478/10004-1254-64-2013-2332. Arh Hig Rada Toksikol. 2013. PMID: 24084354 Review. Croatian.
Cited by
-
Decoupling the effects of nutrition, age, and behavioral caste on honey bee physiology, immunity, and colony health.Front Physiol. 2023 Mar 13;14:1149840. doi: 10.3389/fphys.2023.1149840. eCollection 2023. Front Physiol. 2023. PMID: 36994419 Free PMC article.
-
Whole-genome resequencing of honeybee drones to detect genomic selection in a population managed for royal jelly.Sci Rep. 2016 Jun 3;6:27168. doi: 10.1038/srep27168. Sci Rep. 2016. PMID: 27255426 Free PMC article.
-
Identification of genes related to high royal jelly production in the honey bee (Apis mellifera) using microarray analysis.Genet Mol Biol. 2017 Oct-Dec;40(4):781-789. doi: 10.1590/1678-4685-GMB-2017-0013. Epub 2017 Oct 2. Genet Mol Biol. 2017. PMID: 28981563 Free PMC article.
-
Comparative iTRAQ proteomic profiling of proteins associated with the adaptation of brown planthopper to moderately resistant vs. susceptible rice varieties.PLoS One. 2020 Sep 9;15(9):e0238549. doi: 10.1371/journal.pone.0238549. eCollection 2020. PLoS One. 2020. PMID: 32903256 Free PMC article.
-
In the battle of survival: transcriptome analysis of hypopharyngeal gland of the Apis mellifera under temperature-stress.BMC Genomics. 2025 Feb 17;26(1):151. doi: 10.1186/s12864-025-11322-5. BMC Genomics. 2025. PMID: 39962388 Free PMC article.
References
-
- Li J, Feng M, Zhang Z, Pan Y. Identification of the proteome complement of hypopharyngeal glands from two strains of honeybees (Apis mellifera) Apidologie. 2008;39:199–214. doi: 10.1051/apido:2007059. - DOI
-
- Deseyn J, Billen J. Age-dependent morphology and ultrastructure of the hypopharyngeal gland of Apis mellifera workers (Hymenoptera, Apidae) Apidologie. 2005;36(1):49–57. doi: 10.1051/apido:2004068. - DOI
Publication types
MeSH terms
Substances
LinkOut - more resources
Full Text Sources
Other Literature Sources
Molecular Biology Databases
