. 2014 Aug 29;345(6200):1021-6.
doi: 10.1126/science.1258409. Epub 2014 Aug 7.

X-ray structures of AMPA receptor-cone snail toxin complexes illuminate activation mechanism

Affiliations

X-ray structures of AMPA receptor-cone snail toxin complexes illuminate activation mechanism

Lei Chen et al. Science. .

Abstract

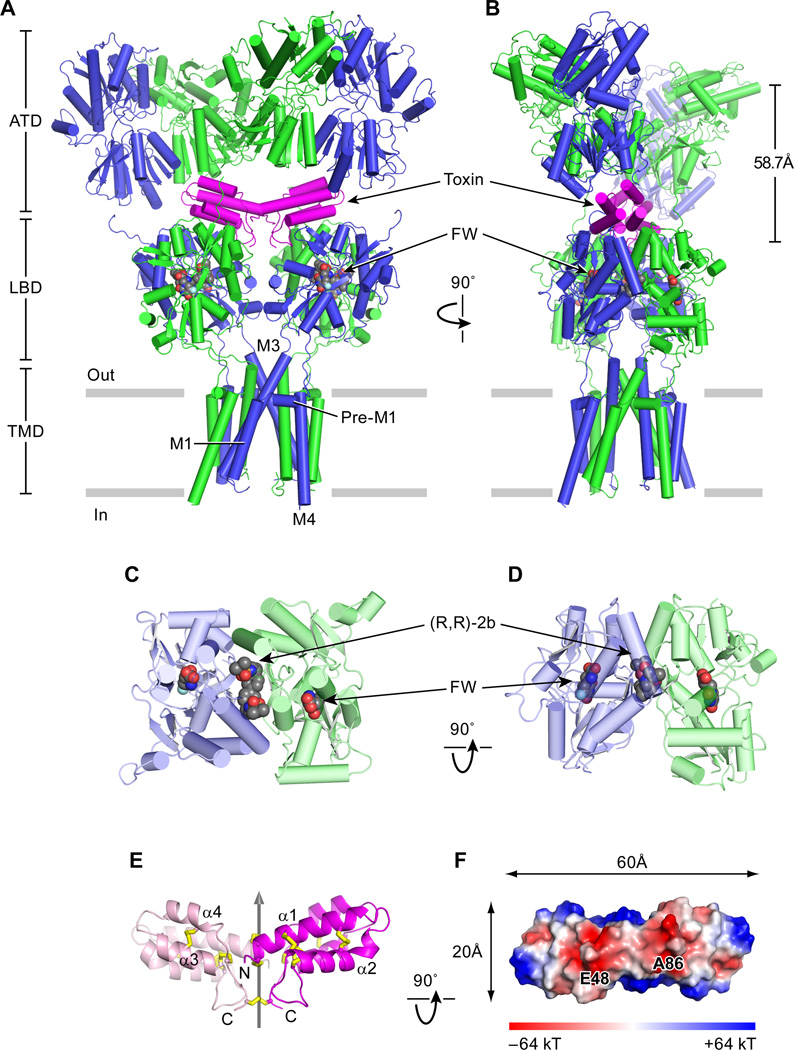
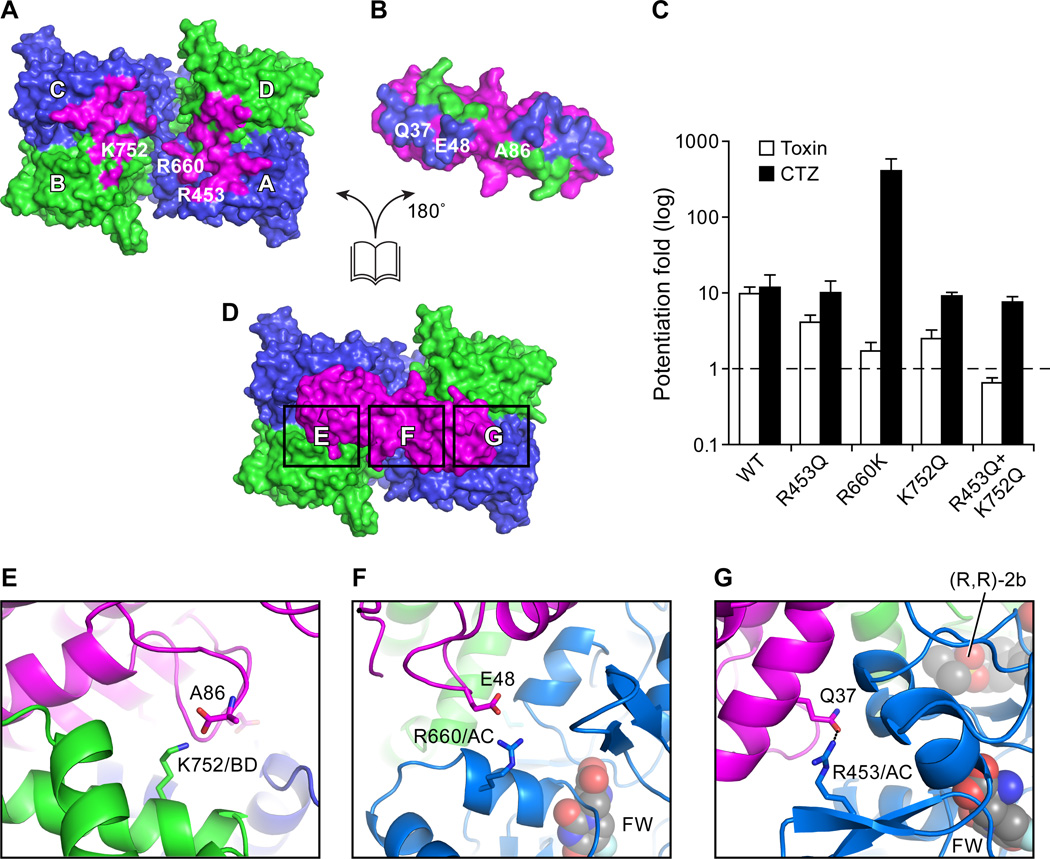
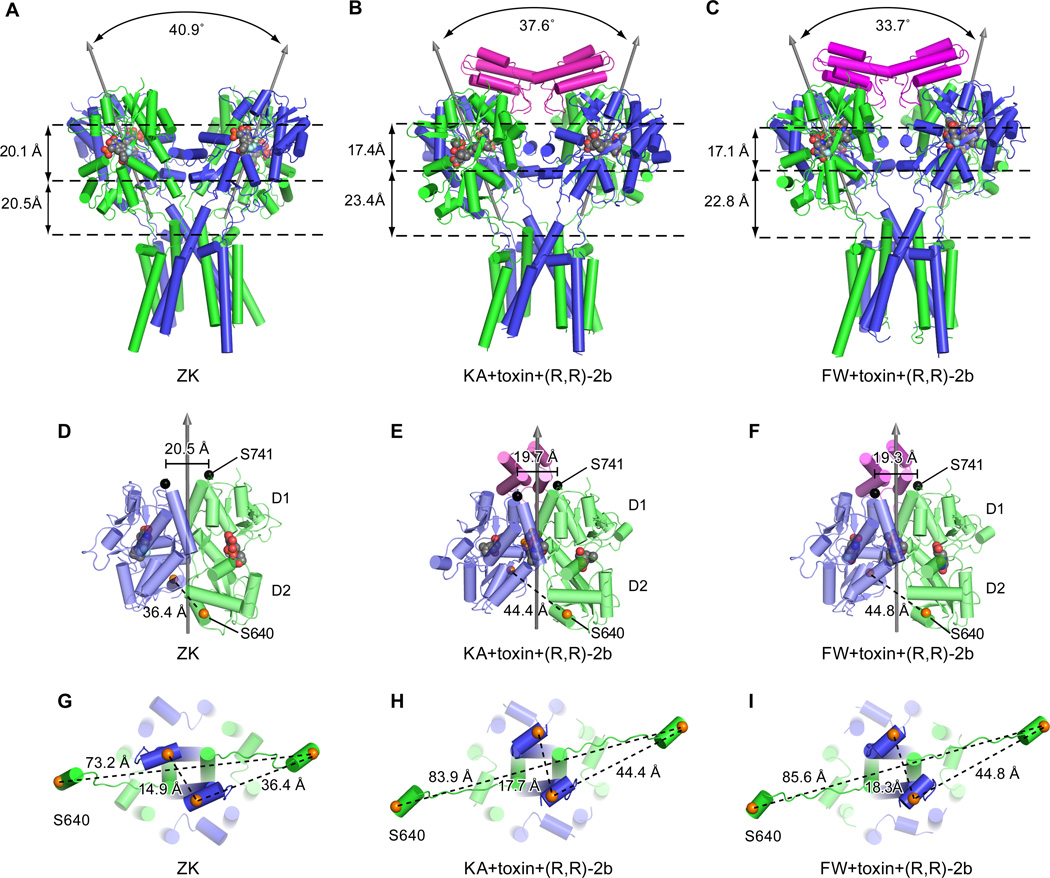
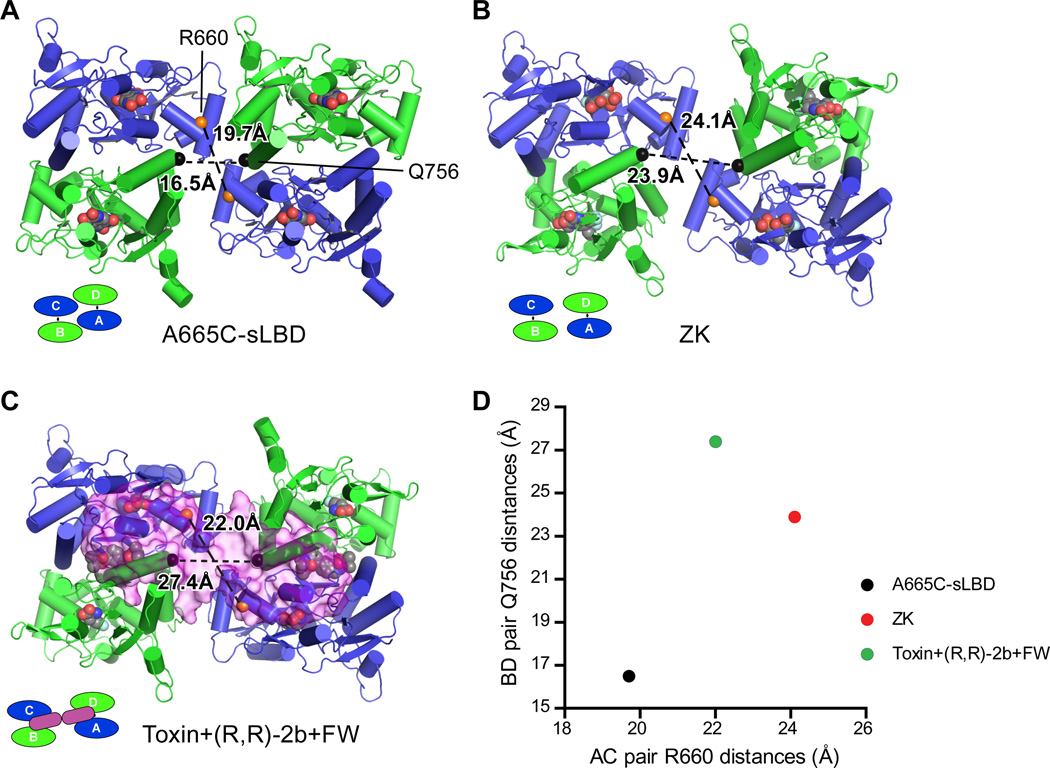
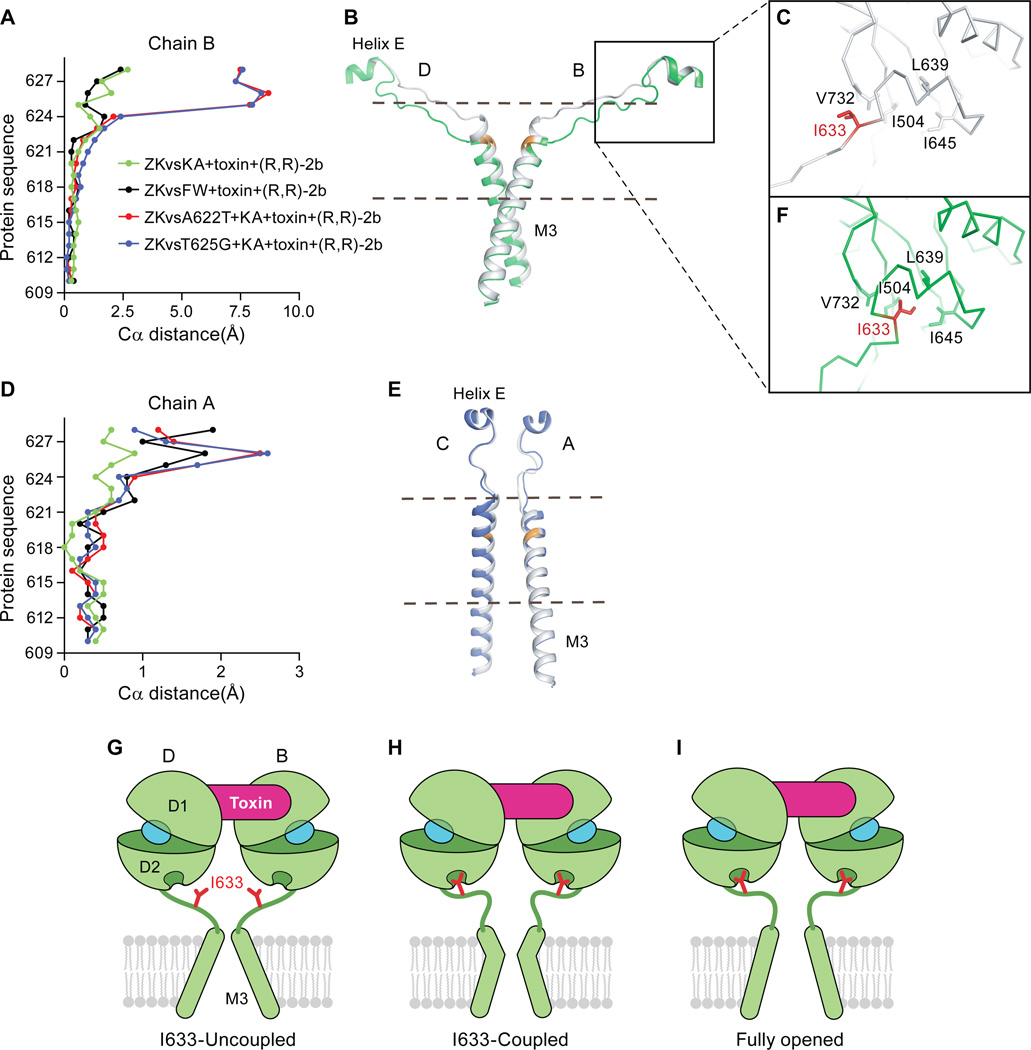
AMPA-sensitive glutamate receptors are crucial to the structural and dynamic properties of the brain, to the development and function of the central nervous system, and to the treatment of neurological conditions from depression to cognitive impairment. However, the molecular principles underlying AMPA receptor activation have remained elusive. We determined multiple x-ray crystal structures of the GluA2 AMPA receptor in complex with a Conus striatus cone snail toxin, a positive allosteric modulator, and orthosteric agonists, at 3.8 to 4.1 angstrom resolution. We show how the toxin acts like a straightjacket on the ligand-binding domain (LBD) "gating ring," restraining the domains via both intra- and interdimer cross-links such that agonist-induced closure of the LBD "clamshells" is transduced into an irislike expansion of the gating ring. By structural analysis of activation-enhancing mutants, we show how the expansion of the LBD gating ring results in pulling forces on the M3 helices that, in turn, are coupled to ion channel gating.


Figures

Fig. 1
Fig. 1
Architecture of GluA2-toxin complex. (A)View of the GluA2-toxin-(R,R)-2b-FW complex, parallel to the membrane, with the A/C subunits in blue, the B/D subunits in green and the toxin in magenta. The (R,R)-2b allosteric modulator and the agonist FW are in space-filling representation. (B) View of the complex rotated 90° around the overall two-fold axis of receptor. The distance between the ATD layer and the LBD layer D1 lobes was defined by measuring the distance between the center of mass (COM) of the ATD layer and the COM of the LBD layer D1 lobes. (C) Close-up top view of LBD AD dimer. (D) Close-up side view of LBD AD dimer. (E) Side view of con-ikot-ikot toxin. Cartoon representation of the dimeric toxin, with one subunit pink and one purple, showing how the subunits are related by a non crystallographic 2-fold axis of symmetry, shown as a gray vertical arrow. Disulfide bonds are shown as yellow sticks. (F) “Bottom view” of the toxin, looking ‘up’ from the LBD layer, showing the electrostatic surface of the toxin. Negatively charged patches on the LBD-facing surface are implicated in receptor-toxin interactions.
Fig. 2
Fig. 2
Complex web of receptor – toxin interactions. (A,B,D) An “open-book” view of the GluA2 LBD - toxin interactions shown in surface representation. (A) View of the GluA2 LBD layer from the ATD, showing the residues that interact with toxin in magenta. (B) View of the toxin residues that interact with the GluA2 A/C subunits in blue and residues that interact with the B/D subunits in green. (C) Extents of potentiation by toxin (hollow bar) and CTZ (black bar) on the “steady state” currents of wild-type GluA2 and GluA2 mutants, elicited by application of 10 mM glutamate. Data are ±S.E.M (n=3). (D) Top view onto the LBD layer from the extracellular side, highlighting key regions of toxin – receptor interactions (shown as black rectangles). (E) Close-up view of the salt bridge between K752 (GluA2 B/D subunit) and the carboxy terminus of the toxin (A86) (D). (F) Close-up view of the R660 (GluA2 A/C subunit) - E48 (toxin) interaction, boxed in (D). (G) Close-up view of the R453 (GluA2 A/C subunit) - Q37 (toxin) interaction, boxed in (D).
Fig. 3
Fig. 3
Conformation of the LBD layer in an activated state. Structures of the GluA2 receptor in the antagonist-bound state “ZK” (A, D, G). Structures of the GluA2 receptor in the KA+toxin+(R,R)-2b bound state (B, E, H) and in complex with FW+toxin+(R,R)-2b (C, F, I). In panels A, B, and C are side views of the LBD-TMD layers showing the angles between the two local two-fold rotation axes of the LBD dimers. The distances between the LBD D1 lobes and the D2 lobes and the distances between the D2 lobes and T625 are measured between the COMs of each layer and are shown on the left. In panels D, E and F are side views of the A/D LBD dimers. Black arrows depict the local two-fold axes of LBD dimers. The Cα atoms of S741 are shown as black spheres, along with the inter-subunit distances. The Cαs atoms of S640 are shown as orange spheres. In panels G, H, and I are views of helix E in the LBD layer and the LBD D2-M3 linker, seen from the LBD layer. The Cα atoms of S640 are also shown as orange spheres, together with inter subunit distances.
Fig. 4
Fig. 4
Toxin stabilizes the LBD ‘gating ring’ in an expanded conformation. Top view of the LBD layer in the A665C-crosslinked GluA2 sLBD structure (PDB 4L17) (A), the GluA2 ZK bound state (B) and the GluA2 FW+toxin+(R,R)-2b bound state (C). The distances between Cα atoms of GluA2 R660 (orange spheres) from the A/C subunits and the distances between the Cαs atoms of GluA2 Q756 (black spheres) from the B/D subunit are shown. Distances are plotted in (D).
Fig. 5
Fig. 5
Coupling of agonist-binding to ion channel gating via the M3-D2 linker. (A) A plot of the differences in position of Cα atoms from residues in the M3 TMD helixes derived from chain B in the structures reported here following superposition of the M1, M3 and M4 helices. (B) Cα trace of the LBD D2 to M3 connections in the B/D subunits where the structure of the GluA2 KA+toxin+(R,R)-2b elements are shown in gray and those derived from the A622T GluA2 mutant KA+toxin+(R,R)-2b complex are shown in green. The main chain atoms of the site of mutation, A622, are illustrated in orange. The region used to generate panel (A) is shown between dash. (C) Close-up view of the “uncoupled” I633 site in the KA+toxin+(R,R)-2b structure subunit B. I633 is shown in red. The side chains of hydrophobic residues that line the I633-binding pocket are shown in sticks. (D) A plot analogous to that shown in panel (A), using the same structures, of the respective Cα distances from residues in the M3 helix from chain A. (E) The LBD D2 to M3 connections in A/C subunits. The structure of the GluA2 KA+toxin+(R,R)-2b complex is shown in gray and the structure of the A622T GluA2 KA+toxin+(R,R)-2b complex is shown in blue. At the mutation site, A622, the back bone is colored in orange. The region used to generate panel (D) is shown between dash. (F) Close-up view of the “coupled” I633 site in the KA+toxin+(R,R)-2b A622T mutant structure subunit B. I633 is in red. The side chains of hydrophobic residues that define the I633-binding pocket are shown in stick representation. Panels G, H and I depict schematic illustrations of a mechanism by which the toxin stabilizes an activated conformation of the LBD layer. Only LBD B/D subunits and M3 helices are shown for clarity. I633 residues are in shown red and agonists are in shown in cyan. (G) The toxin bound and I633-uncoupled state, as we observed in the partial agonist, toxin (R,R)-2b structures. (H) The toxin-bound and I633-coupled state. Here the M3 B/D helices expand via a kink in the helices, yet the ion channel gate remains closed, as we observed in the A622T or T625G structures. (I) A hypothetical model of the toxin bound, I633 coupled and open channel state. We speculate that even with toxin bound the channel probably flickers between G and I, perhaps via H as an intermediate state.

References

    1. Traynelis SF, et al. Glutamate receptor ion channels: structure, regulation, and function. Pharmacol. Rev. 2010;62:405. - PMC - PubMed
    1. Huganir RL, Nicoll RA. AMPARs and synaptic plasticity: The last 25 years. Neuron. 2013;30:704. - PMC - PubMed
    1. O'Neill MJ, Bleakman D, Zimmerman DM, Nisenbaum ES. AMPA receptor potentiators for the treatment of CNS disorders. Curr. Drug Targets: CNS Neurol. Disord. 2004;3:181. - PubMed
    1. Rogawski MA. AMPA receptors as a molecular target in epilepsy therapy. Acta Neurol. Scand. Suppl. 2013;197:9. - PMC - PubMed
    1. Kumar J, Mayer ML. Functional insights from glutamate receptor ion channel structures. Annu. Rev. Physiol. 2013;75:313. - PMC - PubMed

Publication types