. 2014 Sep;42(15):9641-55.
doi: 10.1093/nar/gku674. Epub 2014 Aug 7.

Extensive remodeling of DC function by rapid maturation-induced transcriptional silencing

Affiliations

Extensive remodeling of DC function by rapid maturation-induced transcriptional silencing

Queralt Seguín-Estévez et al. Nucleic Acids Res. 2014 Sep.

Abstract

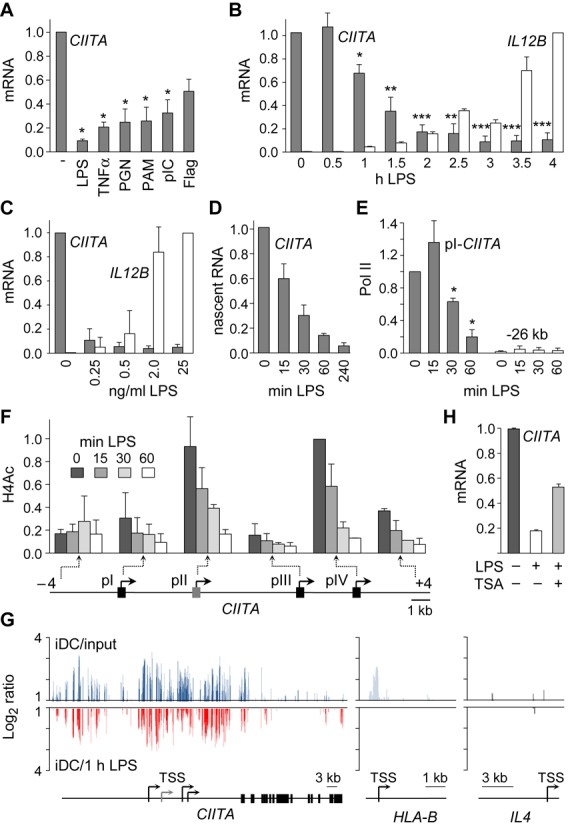
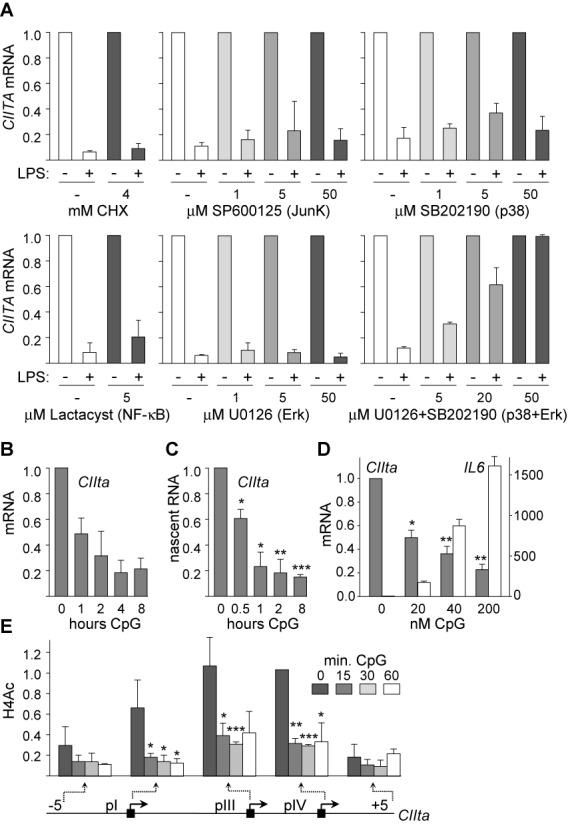
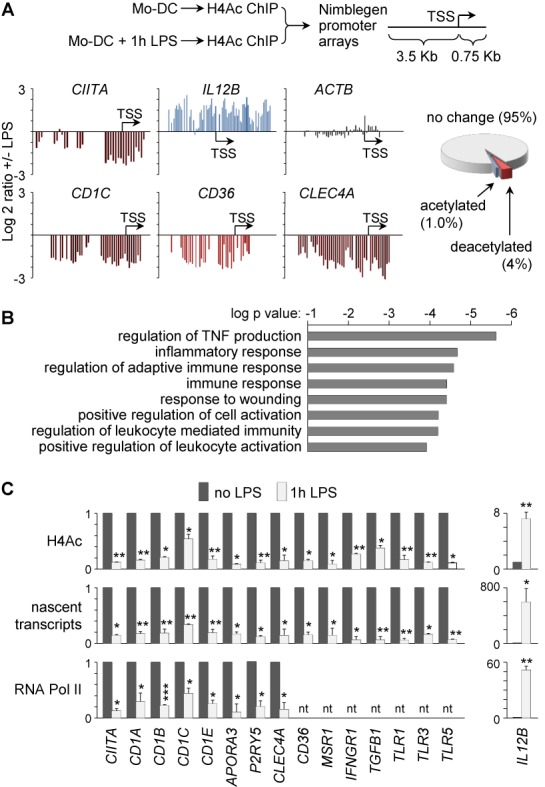
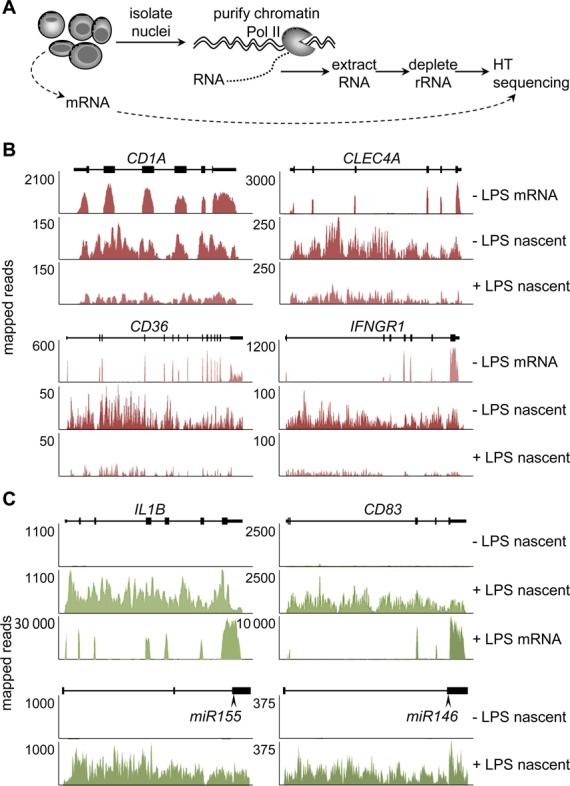
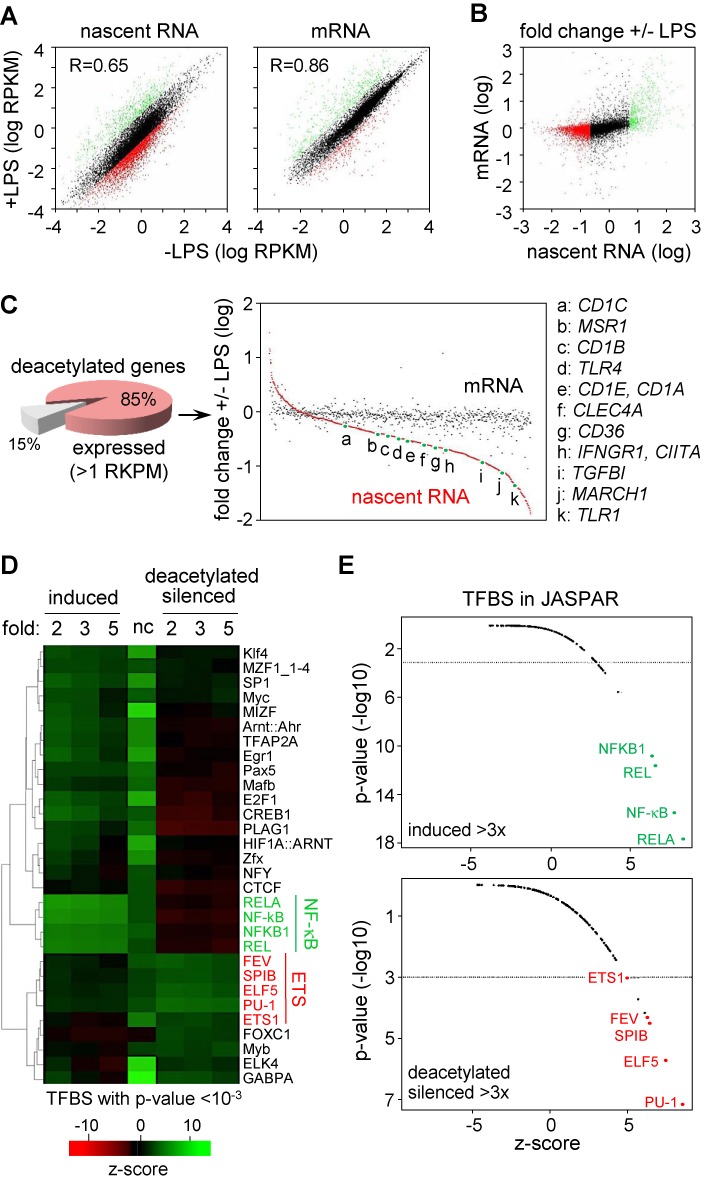
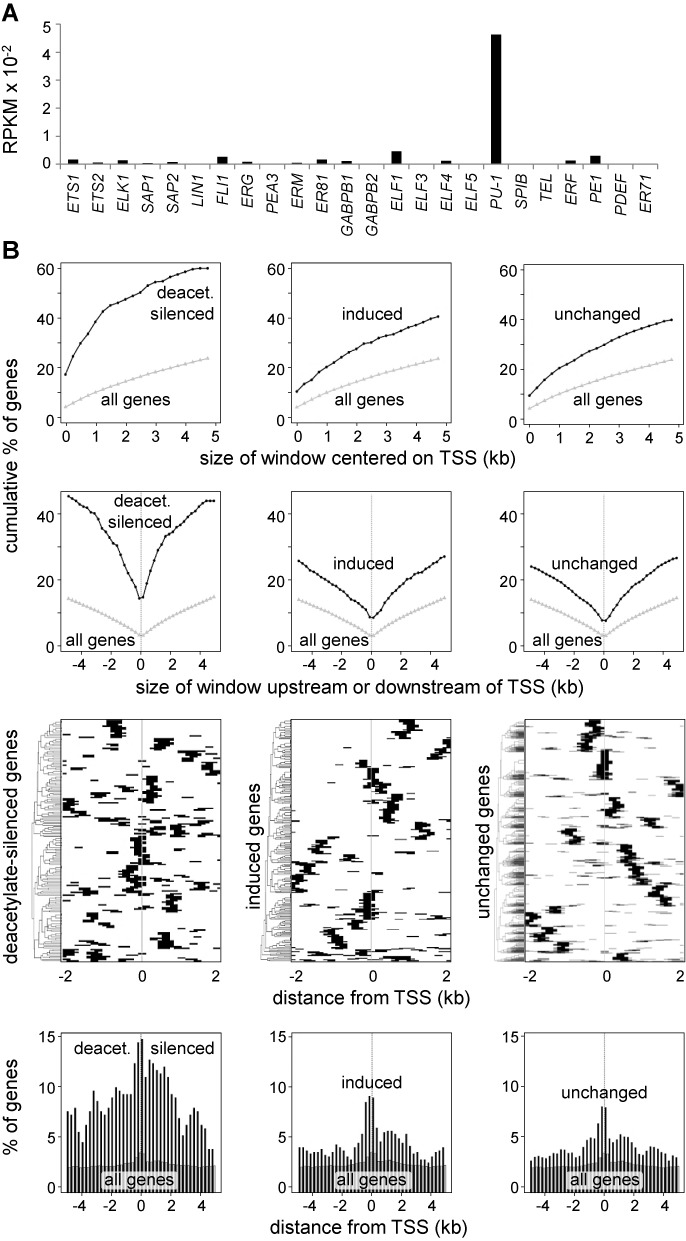
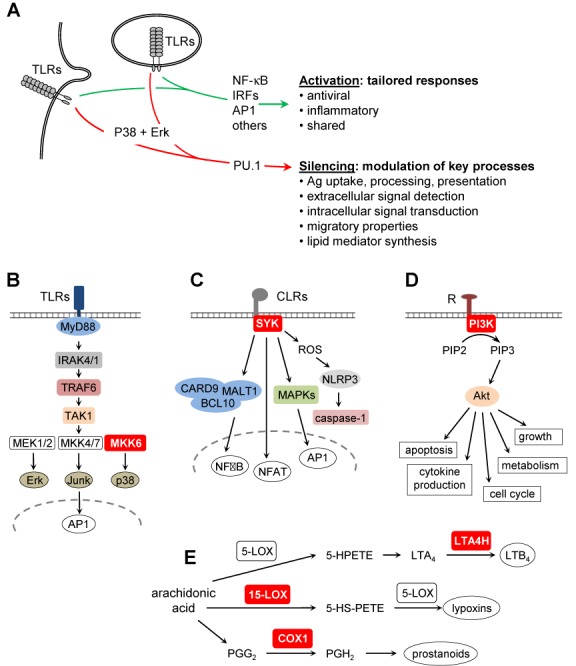
The activation, or maturation, of dendritic cells (DCs) is crucial for the initiation of adaptive T-cell mediated immune responses. Research on the molecular mechanisms implicated in DC maturation has focused primarily on inducible gene-expression events promoting the acquisition of new functions, such as cytokine production and enhanced T-cell-stimulatory capacity. In contrast, mechanisms that modulate DC function by inducing widespread gene-silencing remain poorly understood. Yet the termination of key functions is known to be critical for the function of activated DCs. Genome-wide analysis of activation-induced histone deacetylation, combined with genome-wide quantification of activation-induced silencing of nascent transcription, led us to identify a novel inducible transcriptional-repression pathway that makes major contributions to the DC-maturation process. This silencing response is a rapid primary event distinct from repression mechanisms known to operate at later stages of DC maturation. The repressed genes function in pivotal processes--including antigen-presentation, extracellular signal detection, intracellular signal transduction and lipid-mediator biosynthesis--underscoring the central contribution of the silencing mechanism to rapid reshaping of DC function. Interestingly, promoters of the repressed genes exhibit a surprisingly high frequency of PU.1-occupied sites, suggesting a novel role for this lineage-specific transcription factor in marking genes poised for inducible repression.


Figures

Figure 1.
Figure 1.
Transcriptional silencing of CIITA during DC maturation. (A) CIITA mRNA was quantified in Mo-DCs exposed for 24 h to LPS, TNFα, PGN, PAM, pIC or Flagellin. Results are represented relative to unstimulated DCs. Statistical significance was derived from three experiments: *, P < 0.05 (B) CIITA and IL12B mRNAs were quantified in Mo-DC treated with LPS for the indicated times. Results are represented relative to unstimulated DCs. Statistical significance was derived from three experiments: *, P < 0.05, **, P < 0.01, ***, P < 0.001. (C) CIITA and IL12B mRNAs were quantified in Mo-DCs treated for 6 h with the indicated LPS concentrations. Results are expressed relative to unstimulated DCs. Results are derived from two experiments. (D) Nascent CIITA transcripts were quantified in Mo-DCs exposed to LPS for the indicated times. Results are expressed relative to unstimulated DCs. Results are derived from two experiments. The data is representative of four experiments. (E) Binding of Pol-II to CIITA promoter I and a 26 kb upstream region (background control) was assessed by qChIP in Mo-DCs exposed to LPS for the indicated times. Results are expressed relative to immature DCs at CIITA promoter I. Statistical significance was derived from three experiments: *, P < 0.05. (F) H4Ac was measured in Mo-DCs activated with LPS for the indicated times at the indicated positions of CIITA. Results are expressed relative to H4Ac at promoter IV in immature DCs. Results are derived from two experiments. The data is representative of four experiments. (G) H4Ac-profiling at the CIITA, HLA-B and IL4 genes was performed by ChIP-chip. H4Ac in untreated Mo-DCs (blue) was determined as the signal ratio between immature DCs (iDC) and input DNA. H4-deacetylation (red) was determined as the signal ratio between iDCs and DCs exposed to LPS for 1 h. Ratios are represented on a log2 scale. Maps of the genes are shown below: the scale in kb and TSSs are indicated. (H) CIITA mRNA was quantified in Mo-DCs treated with LPS for 4 h in the absence or presence of TSA. Results are expressed relative to immature DCs. Results are derived from two experiments. The data is representative of four experiments. All measurements were performed in triplicate for each experiment.
Figure 2.
Figure 2.
CIITA silencing is a conserved primary response mediated by the p38 and ERK pathways. (A) CIITA mRNA was quantified in immature and 4 h-LPS-treated Mo-DCs in the presence of the indicated concentrations of cycloheximide (CHX), Jun kinase inhibitor SP600125, p38 inhibitor SB202190, NF-κB inhibitor lactacystin, ERK inhibitor U0126 and U0126 + SB202190. Results are represented relative to immature DCs. Results are derived from two experiments. (B) CIITA mRNA was quantified in DC2114 cells exposed to CpG for the indicated times. Results are presented relative unstimulated DCs. Results are derived from two experiments. (C) Nascent CIITA RNA was quantified in DC2114 cells. exposed to CpG for the indicated times. Results are presented relative unstimulated DCs. Statistical significance was derived from three experiments: *, P < 0.05, **, P < 0.01, ***, P < 0.001. (D) CIITA and Il6 mRNAs were quantified in DC2114 cells treated for 6 h with the indicated concentrations of CpG. Statistical significance was derived from three experiments: *, P < 0.05, **, P < 0.01. (E) H4Ac was measured in DC2114 cells activated with CpG for the indicated times at the indicated positions of the CIIta gene. Results are expressed relative to H4Ac at promoter IV in immature DCs. Statistical significance was derived from three experiments: *, P < 0.05, **, P < 0.01, ***, P < 0.001. All measurements were performed in triplicate for each experiment.
Figure 3.
Figure 3.
Identification of promoters undergoing H4-deacetylation upon Mo-DC maturation. (A) Schematic representation of the ChIP-chip strategy used to identify promoters that are deacetylated in Mo-DCs after 1 h of LPS treatment (top). Representative results for CIITA, IL12B, ACTB, CD1C, CD36 and CLEC4A are provided: signal ratios between 1 h-LPS-treated and untreated Mo-DCs are represented on a log2 scale (bottom left). The percentages of promoters displaying increased or decreased H4Ac are shown (bottom right). (B) Gene-ontology analysis of genes exhibiting LPS-induced H4-deacetylation at their promoters was done using David (http://david.abcc.ncifcrf.gov/). (C) H4-deacetylation (top), nascent transcripts (middle) and pol-II occupancy (bottom) were quantified for the indicated genes in untreated and 1 h-LPS-treated Mo-DCs: results are expressed relative to untreated DCs; nt, not tested. Statistical significance was derived from three experiments: *, P < 0.05, **, P < 0.01, ***, P < 0.001. All measurements were performed in triplicate for each experiment.
Figure 4.
Figure 4.
Transcriptome profiling by nascent-transcript sequencing. (A) Schematic representation of the strategy used for purifying and sequencing chromatin-bound nascent transcripts. mRNA was purified and sequenced in parallel. (B and C) Nascent-transcript-sequencing profiles are shown for representative silenced (B) and induced (C) genes: results are expressed as numbers of reads mapping to the genes in untreated and 1 h-LPS-treated Mo-DCs; schematic maps of the genes are depicted; exons are indicated as boxes; positions of mature microRNA sequences are indicated for microRNA genes; mRNA-sequencing profiles from untreated Mo-DCs are included as controls for protein-coding genes.
Figure 5.
Figure 5.
Characterization of nascent-transcript-sequencing data. (A) The dot plots show a global analysis of altered nascent-transcript (left) and mRNA (right) expression induced in 1 h-LPS-treated Mo-DCs: results are represented as RPKM (reads per kb per million) on a log scale; induced (>2x), silenced (>2x) and unchanged genes are represented as green, red and black dots, respectively. (B) The dot plot compares changes in nascent-transcript and mRNA expression induced in 1 h-LPS-treated Mo-DCs: results are represented as fold change on a log scale; genes that are induced (>2x), silenced (>2x) and unchanged at the nascent-RNA level are represented as green, red and black dots, respectively. (C) The pie chart shows the percentage of deacetylated genes expressed more than 1 RPKM in immature Mo-DCs. The dot plot shows 1 h-LPS-induced changes in nascent-transcript (red dots) and mRNA (black dots) expression for deacetylated genes; genes are ordered with respect to their change in nascent-transcript expression; positions of representative genes are highlighted. (D) TFBS enrichment analyses were performed for promoters of genes that are induced (>2, 3 or 5-fold), deacetylated and silenced (>2, 3 or 5-fold), or exhibit no change (nc) in expression in Mo-DCs after 1 h of LPS treatment. TFBSs were defined according to JASPAR. The heat map shows the relative enrichment (z-score) of TFBSs that are significantly over-represented (P-value < 10−3). (E) The graphs summarize the z-scores and P-values for all TFBSs in genes that are induced >3-fold (top) or deacetylated and silenced >3-fold (bottom): NF-κB (green) and ETS (red) TFBSs are highlighted.
Figure 6.
Figure 6.
Mapping of PU.1-binding in Mo-DC. (A) Relative expression (mRNA-sequencing) of mRNAs encoding ETS family members in immature Mo-DCs. (B) PU.1-ocuppied sites (ChIP-sequencing) were analyzed in the promoter regions of genes that are deacetylated and silenced >5-fold (left column), induced >5-fold (center column), or exhibit no change in expression (right column) in Mo-DCs after 1 h of LPS treatment. Panels show the percent of genes having at least 1 PU.1 peak within a window of the indicated size centered on the TSS (first row), the percent of genes containing at least 1 PU.1 peak within the indicated distance upstream or downstream of the TSS (second row), heat maps indicating the positions of PU.1 peaks (black lines) within 4 kb regions centered on the TSS (third row) and the percent of genes having at least one PU.1 peak situated at the indicated distance upstream or downstream of the TSS (bottom row). In all graphs, the entire set of human genes was used as baseline reference. RPKM, reads per kb per million.
Figure 7.
Figure 7.
Functional relevance of rapid transcriptional silencing in activated DCs. (A) Schematic summary of signal-transduction pathways and functional consequences triggered by TLR-engagement in DCs: our results define a novel primary silencing pathway that is distinct from known gene induction mechanisms and modulates key processes during DC maturation. The silencing mechanism affects the expression of pivotal proteins (red boxes) implicated in: (B) TLR signaling (MKK6), (C) CLR signaling (SYK), (D) PI3K-Akt signaling (PI3K) and (E) icosanoid biosynthesis (LTA4H, 15-LOX, COX1).

Similar articles

Cited by

References

    1. Joffre O., Nolte M.A., Sporri R., Reis e Sousa C. Inflammatory signals in dendritic cell activation and the induction of adaptive immunity. Immunol. Rev. 2009;227:234–247. - PubMed
    1. Satpathy A.T., Wu X., Albring J.C., Murphy K.M. Re(de)fining the dendritic cell lineage. Nat. Immunol. 2012;13:1145–1154. - PMC - PubMed
    1. Watts C., West M.A., Zaru R. TLR signalling regulated antigen presentation in dendritic cells. Curr. Opin. Immunol. 2010;22:124–130. - PubMed
    1. Barton G.M., Kagan J.C. A cell biological view of Toll-like receptor function: regulation through compartmentalization. Nat. Rev. Immunol. 2009;9:535–542. - PMC - PubMed
    1. Palm N.W., Medzhitov R. Pattern recognition receptors and control of adaptive immunity. Immunol. Rev. 2009;227:221–233. - PubMed

Publication types

Associated data