

Automatic quantification of subarachnoid hemorrhage on noncontrast CT
- PMID: 25104292
- PMCID: PMC7965299
- DOI: 10.3174/ajnr.A4042
Automatic quantification of subarachnoid hemorrhage on noncontrast CT
Abstract
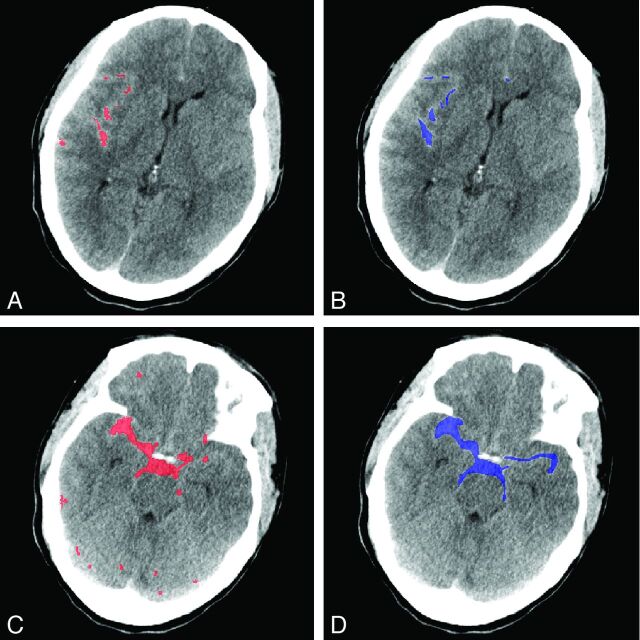
Background and purpose: Quantification of blood after SAH on initial NCCT is an important radiologic measure to predict patient outcome and guide treatment decisions. In current scales, hemorrhage volume and density are not accounted for. The purpose of this study was to develop and validate a fully automatic method for SAH volume and density quantification.
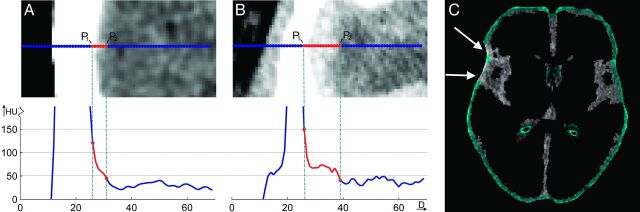
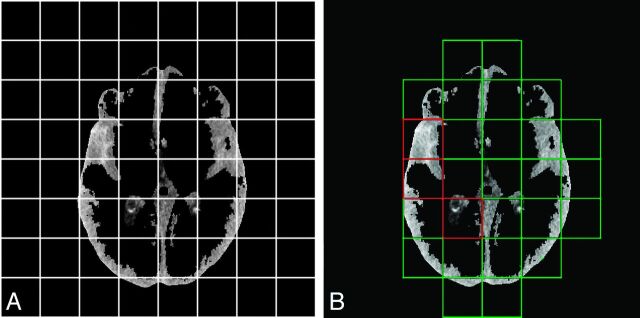
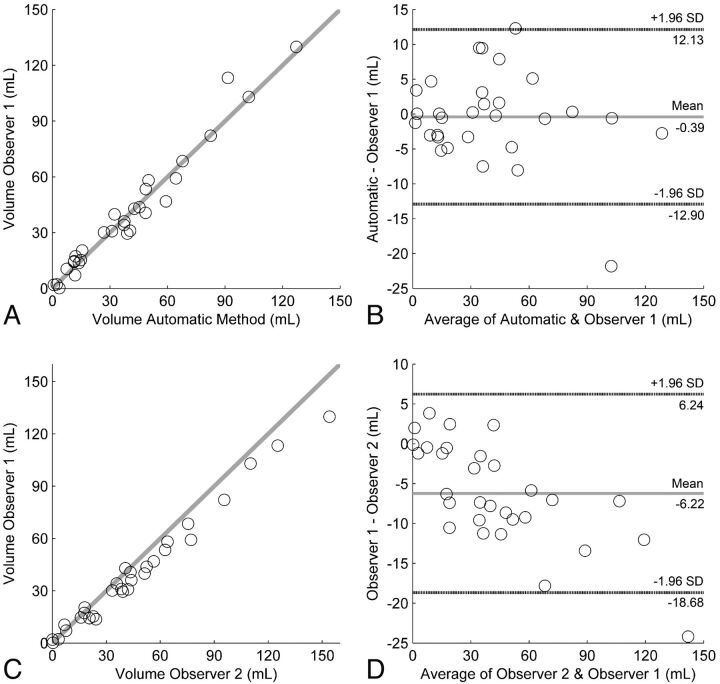
Materials and methods: The automatic method is based on a relative density increase due to the presence of blood from different brain structures in NCCT. The method incorporates density variation due to partial volume effect, beam-hardening, and patient-specific characteristics. For validation, automatic volume and density measurements were compared with manual delineation on NCCT images of 30 patients by 2 radiologists. The agreement with the manual reference was compared with interobserver agreement by using the intraclass correlation coefficient and Bland-Altman analysis for volume and density.
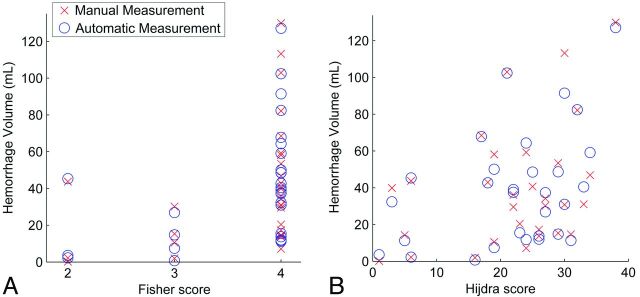
Results: The automatic measurement successfully segmented the hemorrhage of all 30 patients and showed high correlation with the manual reference standard for hemorrhage volume (intraclass correlation coefficient = 0.98 [95% CI, 0.96-0.99]) and hemorrhage density (intraclass correlation coefficient = 0.80 [95% CI, 0.62-0.90]) compared with intraclass correlation coefficient = 0.97 (95% CI, 0.77-0.99) and 0.98 (95% CI, 0.89-0.99) for manual interobserver agreement. Mean SAH volume and density were, respectively, 39.3 ± 31.5 mL and 62.2 ± 5.9 Hounsfield units for automatic measurement versus 39.7 ± 32.8 mL and 61.4 ± 7.3 Hounsfield units for manual measurement. The accuracy of the automatic method was excellent, with limits of agreement of -12.9-12.1 mL and -7.6-9.2 Hounsfield units.
Conclusions: The automatic volume and density quantification is very accurate compared with manual assessment. As such, it has the potential to provide important determinants in clinical practice and research.
© 2014 by American Journal of Neuroradiology.
Figures
References
-
- Feigin VL, Lawes CM, Bennett DA, et al. Stroke epidemiology: a review of population-based studies of incidence, prevalence, and case-fatality in the late 20th century. Lancet Neurol 2003;2:43–53 - PubMed
-
- Anderson C, Anderson N, Bonita R. Epidemiology of aneurysmal subarachnoid hemorrhage in Australia and New Zealand: incidence and case fatality from the Australasian Cooperative Research on Subarachnoid Hemorrhage Study (ACROSS). Stroke 2000;31:1843–50 - PubMed
-
- Rosen DS, Macdonald RL. Subarachnoid hemorrhage grading scales: a systematic review. Neurocrit Care 2005;2:110–18 - PubMed
-
- van Gijn J, Kerr RS, Rinkel GJ. Subarachnoid haemorrhage. Lancet 2007;369:306–18 - PubMed
-
- Hop JW, Rinkel GJ, Algra A, et al. Case-fatality rates and functional outcome after subarachnoid hemorrhage: a systematic review. Stroke 1997;28:660–64 - PubMed
MeSH terms
LinkOut - more resources
Full Text Sources
Other Literature Sources
Medical
Research Materials