. 2014 Aug;19(8):086006.
doi: 10.1117/1.JBO.19.8.086006.

Label-free photoacoustic nanoscopy

Affiliations

Label-free photoacoustic nanoscopy

Amos Danielli et al. J Biomed Opt. 2014 Aug.

Abstract

Super-resolution microscopy techniques - capable of overcoming the diffraction limit of light - have opened new opportunities to explore subcellular structures and dynamics not resolvable in conventional far-field microscopy. However, relying on staining with exogenous fluorescent markers, these techniques can sometimes introduce undesired artifacts to the image, mainly due to large tagging agent sizes and insufficient or variable labeling densities. By contrast, the use of endogenous pigments allows imaging of the intrinsic structures of biological samples with unaltered molecular constituents. Here, we report label-free photoacoustic (PA) nanoscopy, which is exquisitely sensitive to optical absorption, with an 88 nm resolution. At each scanning position, multiple PA signals are successively excited with increasing laser pulse energy. Because of optical saturation or nonlinear thermal expansion, the PA amplitude depends on the nonlinear incident optical fluence. The high-order dependence, quantified by polynomial fitting, provides super-resolution imaging with optical sectioning. PA nanoscopy is capable of super-resolution imaging of either fluorescent or nonfluorescent molecules.


Figures

Fig. 1
Fig. 1
Principle of photoacoustic (PA) nanoscopy. (a) Schematic of the PA nanoscope. At each scanning position, a train of pulses with increasing energy successively excites PA signals. Due to optical saturation or nonlinear thermal expansion, the PA amplitude increases nonlinearly with the increasing incident energy. (b) Fluence distribution of a Gaussian illumination beam of 226 nm full width at half maximum, which is scanned over two absorbers 90 nm apart. (c) Image from the normalized linear PA coefficient, c1, of the two absorbers. Proportional to μa0f^s, c1 is diffraction limited. (d) Image from normalized c3, which resolves the two particles. (e) Contrast as a function of the separation between the two particles for c1, f^s3, and c3 when Γ1(n=3)=0.5·γ2(n=3)ηthFsatμa0max. The spatial resolutions as defined by the particle separations at 10% contrast (horizontal dashed line) are 234, 135, and 90  nm, respectively.
Fig. 2
Fig. 2
Imaging gold nanoparticles of 100 nm diameter. (a) and (b) Images acquired with atomic force microscopy (left column), conventional PA microscopy (PAM) (middle column), and third-order PA nanoscopy, c3 (right column). (c) and (d) Normalized image amplitude along the dashed lines in (a) and (b). (e) to (g) Raw PA amplitude as a function of the incident pulse fluence when the center of the beam is (e) outside, (f) at the center, and (g) between the gold nanoparticles. Each black dashed line in (e) to (g) is the tangent of the nonlinear curve at the origin. The slope of the black dashed line represents the conventional linear PA amplitude (Video 1, QuickTime, 0.3 Mb) [URL: http://dx.doi.org/10.1117/1.JBO.19.8.086006.1].
Fig. 3
Fig. 3
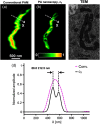
Imaging mitochondria in NIH 3T3 fibroblasts. A typical tubular shaped mitochondrion imaged by (a) conventional PAM and (b) third-order (c3) PA nanoscopy. (c) A similar structure of mitochondria is revealed by transmission electron microscopy. (d) Normalized image amplitude along the dashed lines in (a) and (b) (Video 2, QuickTime, 0.1 Mb) [URL: http://dx.doi.org/10.1117/1.JBO.19.8.086006.2].
Fig. 4
Fig. 4
Imaging mouse embryonic fibroblasts (MEFs). Confocal microscopy images of (a) a wild-type MEF, (b) MEFs in which the Mitofusin-1 gene was knocked out (Mfn1-KO), (c) MEFs in which the Mitofusin-2 gene was knocked out (Mfn2-KO), and (d) MEFs in which both Mfn1 and Mfn2 were knocked out (Mfn1,Mfn2-DKO). Conventional PAM images of (e) a wild-type MEF, (f) Mfn1-KO, (g) Mfn2-KO, and (h) Mfn1,Mfn2-DKO. Conventional PAM and third-order (c3) PA nanoscopy images of mitochondria in (i) a wild-type MEF, (j) Mfn1-KO, (k) Mfn2-KO, and (l) Mfn1,Mfn2-DKO. The mitochondria in wild-type MEF cells show global interconnectivity, while in the Mfn knockout cells, the network is fragmented and individual organelles are readily resolved (Video 3, QuickTime, 0.7 Mb) [URL: http://dx.doi.org/10.1117/1.JBO.19.8.086006.3].
Fig. 5
Fig. 5
Imaging melanoma cells. (a) and (b) Conventional PA images of melanoma cells. A cluster of melanosomes imaged by (c) conventional PAM, (d) second-order (c2), and (e) third-order (c3) PA nanoscopy (Video 4, QuickTime, 0.1 Mb) [URL: http://dx.doi.org/10.1117/1.JBO.19.8.086006.4]. (f) and (g) Normalized image amplitude along the dashed lines in (c) to (e).
Fig. 6
Fig. 6
Optical sectioning in PA nanoscopy. Cross-sectional images of red blood cells at 1 μm depth acquired using a 1.2 NA objective by (a) conventional PAM and (b) second-order PA nanoscopy (c2). The high-order fluence dependence enables optical sectioning (Video 5, QuickTime, 0.4 Mb [URL: http://dx.doi.org/10.1117/1.JBO.19.8.086006.5], Video 6, QuickTime, 2.5 Mb [URL: http://dx.doi.org/10.1117/1.JBO.19.8.086006.6]). Three-dimensionally rendered structural images of mitochondria acquired at eight focal depths, 300 nm apart, by (c) conventional PAM and (d) third-order (c3) PA nanoscopy (Video 7, QuickTime, 0.9 Mb) [URL: http://dx.doi.org/10.1117/1.JBO.19.8.086006.7].
Fig. 7
Fig. 7
Imaging melanoma cells before and after PA nanoscopy. (a) and (b) Melanoma cells imaged by (a) conventional PAM before PA nanoscopy and (b) phase microscopy after PA nanoscopy.

References

    1. Huang B., Bates M., Zhuang X. W., “Super-resolution fluorescence microscopy,” Annu. Rev. Biochem. 78(1), 993–1016 (2009).ARBOAW10.1146/annurev.biochem.77.061906.092014 - DOI - PMC - PubMed
    1. Mueller V., et al. , “STED nanoscopy reveals molecular details of cholesterol- and cytoskeleton-modulated lipid interactions in living cells,” Biophys. J. 101(7), 1651–1660 (2011).BIOJAU10.1016/j.bpj.2011.09.006 - DOI - PMC - PubMed
    1. Hell S. W., Wichmann J., “Breaking the diffraction resolution limit by stimulated emission: stimulated-emission-depletion fluorescence microscopy,” Opt. Lett. 19(11), 780–782 (1994).OPLEDP10.1364/OL.19.000780 - DOI - PubMed
    1. Hell S. W., Kroug M., “Ground-state-depletion fluorescence microscopy—a concept for breaking the diffraction resolution limit,” Appl. Phys. B 60(5), 495–497 (1995).APBOEM10.1007/BF01081333 - DOI
    1. Gustafsson M. G. L., “Nonlinear structured-illumination microscopy: wide-field fluorescence imaging with theoretically unlimited resolution,” Proc. Natl. Acad. Sci. U. S. A. 102(37), 13081–13086 (2005).10.1073/pnas.0406877102 - DOI - PMC - PubMed

Publication types