

Children's height and weight in rural and urban populations in low-income and middle-income countries: a systematic analysis of population-representative data
- PMID: 25104494
- PMCID: PMC4547325
- DOI: 10.1016/S2214-109X(13)70109-8
Children's height and weight in rural and urban populations in low-income and middle-income countries: a systematic analysis of population-representative data
Abstract
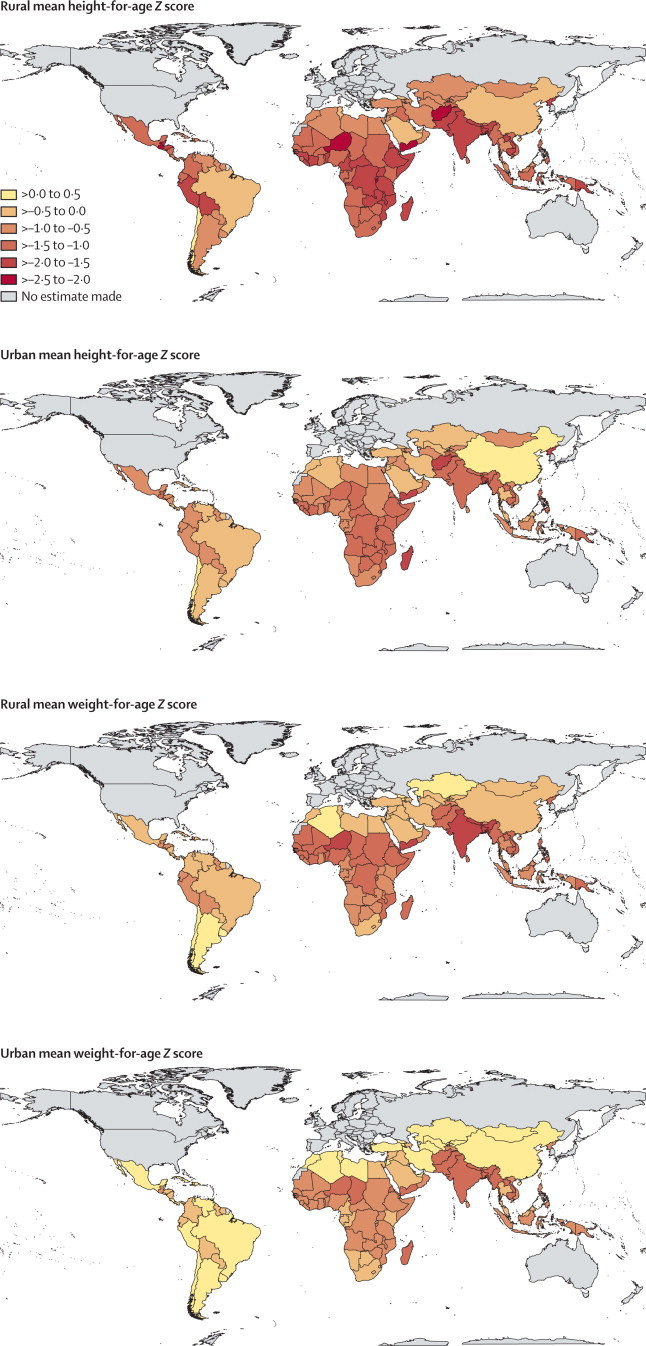
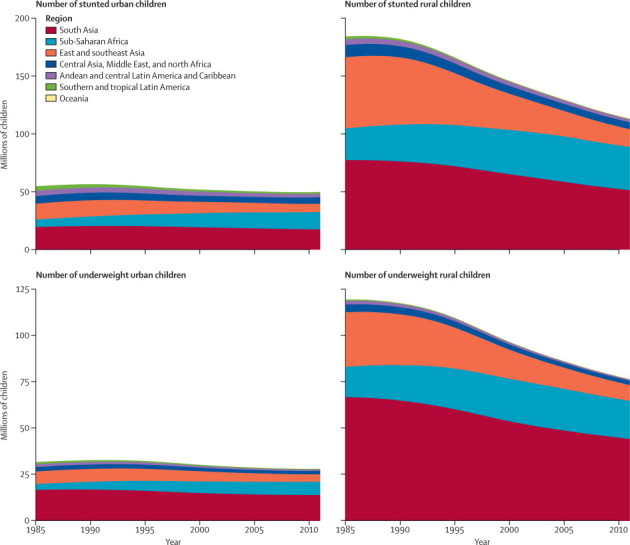
Background: Urban living affects children's nutrition and growth, which are determinants of their survival, cognitive development, and lifelong health. Little is known about urban-rural differences in children's height and weight, and how these differences have changed over time. We aimed to investigate trends in children's height and weight in rural and urban settings in low-income and middle-income countries, and to assess changes in the urban-rural differentials in height and weight over time.
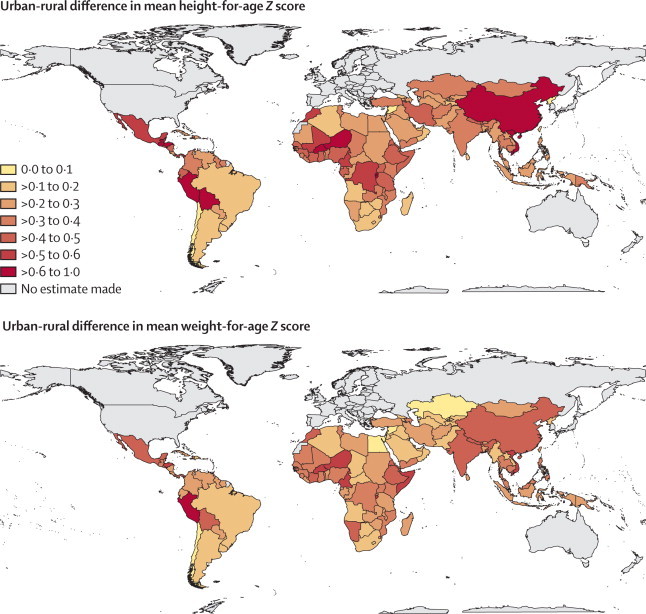
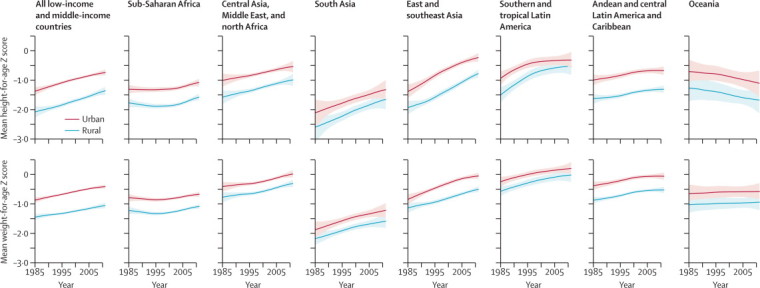
Methods: We used comprehensive population-based data and a Bayesian hierarchical mixture model to estimate trends in children's height-for-age and weight-for-age Z scores by rural and urban place of residence, and changes in urban-rural differentials in height and weight Z scores, for 141 low-income and middle-income countries between 1985 and 2011. We also estimated the contribution of changes in rural and urban height and weight, and that of urbanisation, to the regional trends in these outcomes.
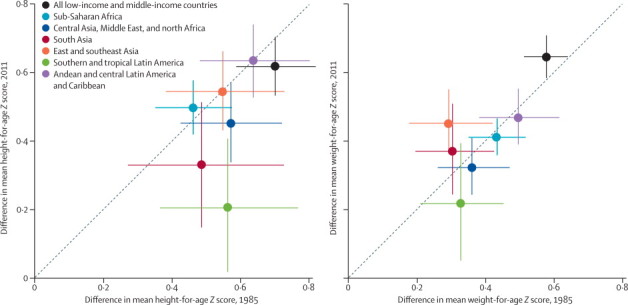
Findings: Urban children are taller and heavier than their rural counterparts in almost all low-income and middle-income countries. The urban-rural differential is largest in Andean and central Latin America (eg, Peru, Honduras, Bolivia, and Guatemala); in some African countries such as Niger, Burundi, and Burkina Faso; and in Vietnam and China. It is smallest in southern and tropical Latin America (eg, Chile and Brazil). Urban children in China, Chile, and Jamaica are the tallest in low-income and middle-income countries, and children in rural areas of Burundi, Guatemala, and Niger the shortest, with the tallest and shortest more than 10 cm apart at age 5 years. The heaviest children live in cities in Georgia, Chile, and China, and the most underweight in rural areas of Timor-Leste, India, Niger, and Bangladesh. Between 1985 and 2011, the urban advantage in height fell in southern and tropical Latin America and south Asia, but changed little or not at all in most other regions. The urban-rural weight differential also decreased in southern and tropical Latin America, but increased in east and southeast Asia and worldwide, because weight gain of urban children outpaced that of rural children.
Interpretation: Further improvement of child nutrition will require improved access to a stable and affordable food supply and health care for both rural and urban children, and closing of the the urban-rural gap in nutritional status.
Funding: Bill & Melinda Gates Foundation, Grand Challenges Canada, UK Medical Research Council.
Copyright © 2013 Paciorek et al. Open Access article distributed under the terms of CC BY. Published by .. All rights reserved.
Figures
Comment in
-
Tracking nutritional changes in an urbanising world beyond 2015.Lancet Glob Health. 2013 Nov;1(5):e245-6. doi: 10.1016/S2214-109X(13)70080-9. Epub 2013 Oct 24. Lancet Glob Health. 2013. PMID: 25104484 No abstract available.
References
-
- Black RE, Allen LH, Bhutta ZA, for the Maternal and Child Undernutrition Study Group Maternal and child undernutrition: global and regional exposures and health consequences. Lancet. 2008;371:243–260. - PubMed
-
- Black RE, Victora CG, Walker SP. Maternal and child undernutrition and overweight in low-income and middle-income countries. Lancet. 2013;382:427–451. - PubMed
-
- Stevens GA, Finucane MM, Paciorek CJ, on behalf of Nutrition Impact Model Study Group (Child Growth) Trends in mild, moderate, and severe stunting and underweight, and progress towards MDG 1 in 141 developing countries: a systematic analysis of population representative data. Lancet. 2012;380:824–834. - PMC - PubMed
Publication types
MeSH terms
Grants and funding
LinkOut - more resources
Full Text Sources
Other Literature Sources
Medical
Miscellaneous
