. 2014 Oct;198(2):497-508.
doi: 10.1534/genetics.114.167908. Epub 2014 Aug 7.

Identifying causal variants at loci with multiple signals of association

Affiliations

Identifying causal variants at loci with multiple signals of association

Farhad Hormozdiari et al. Genetics. 2014 Oct.

Abstract

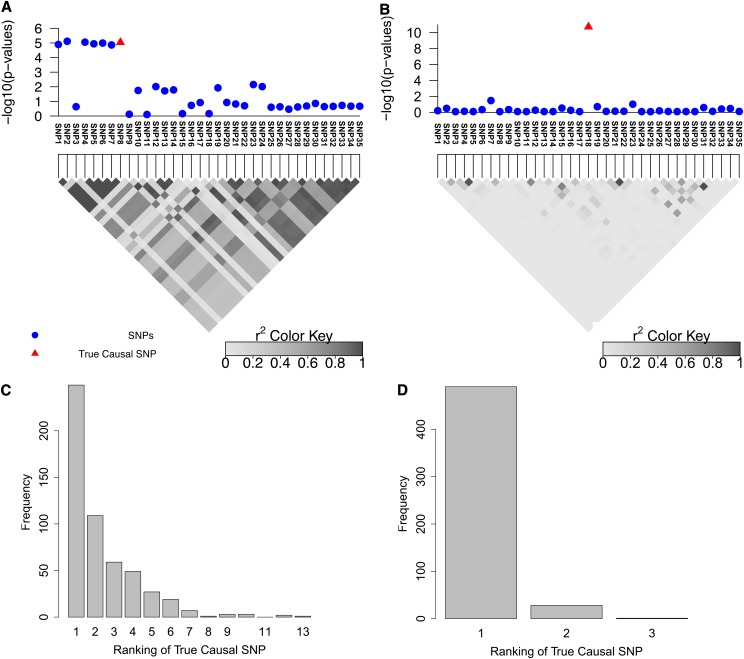
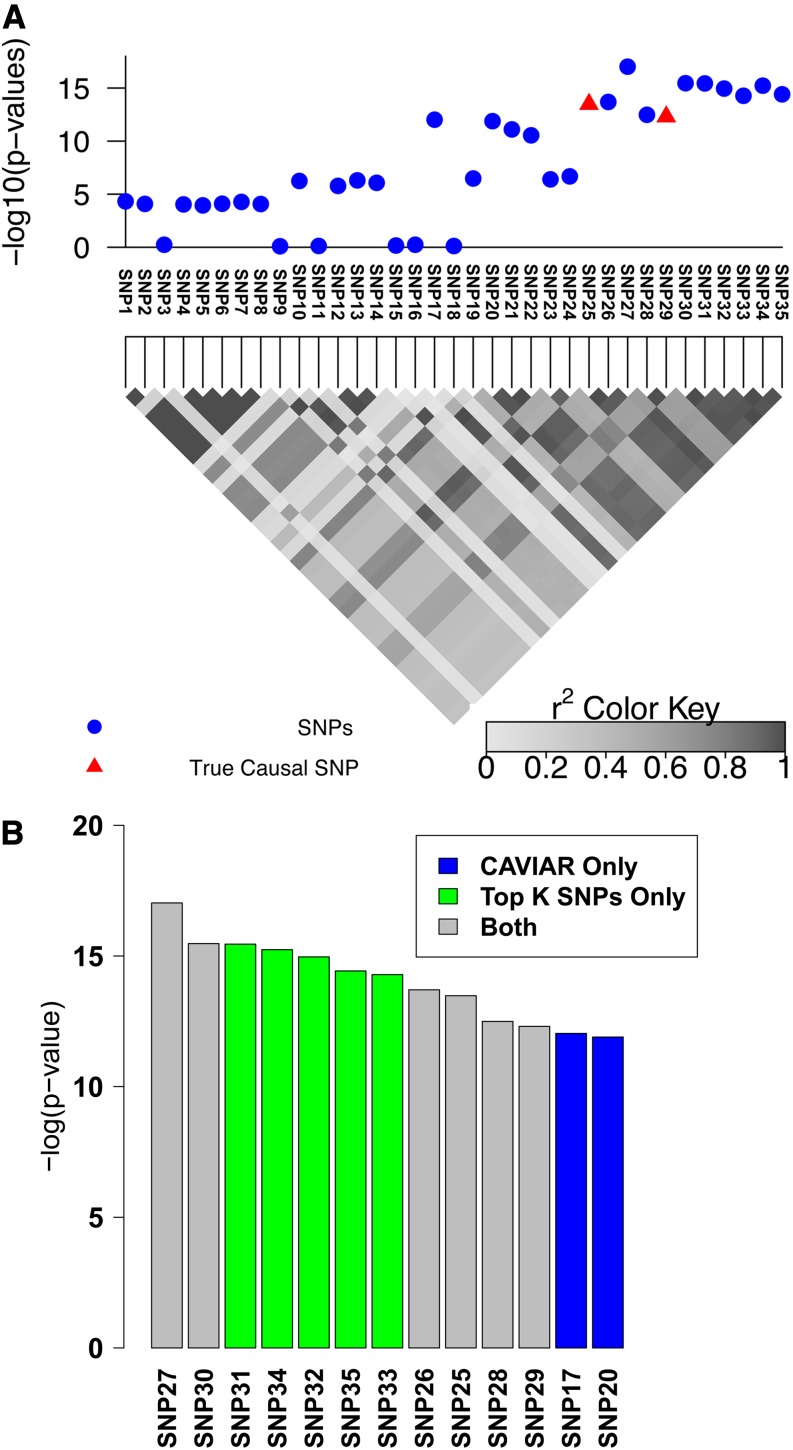
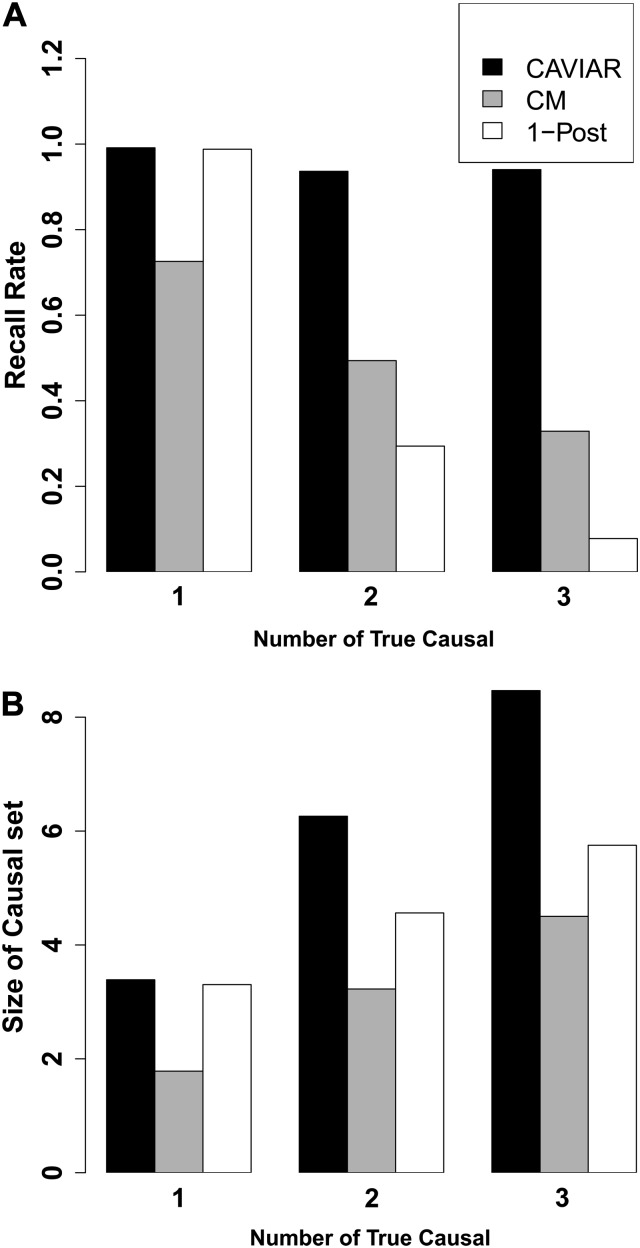
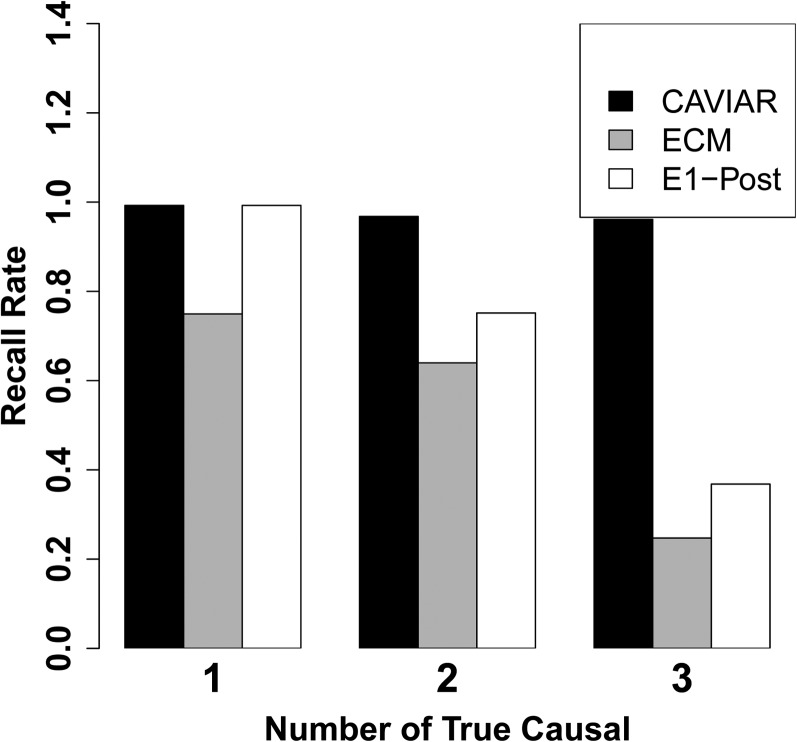
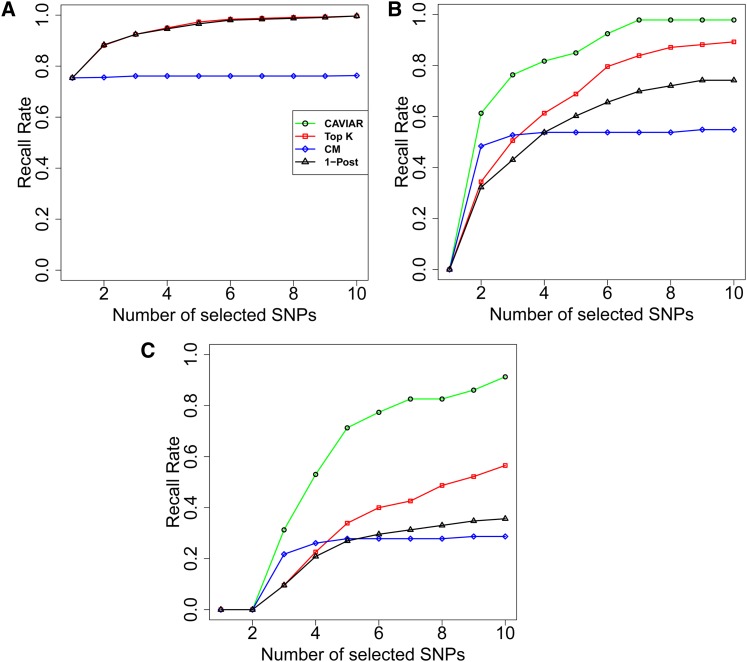
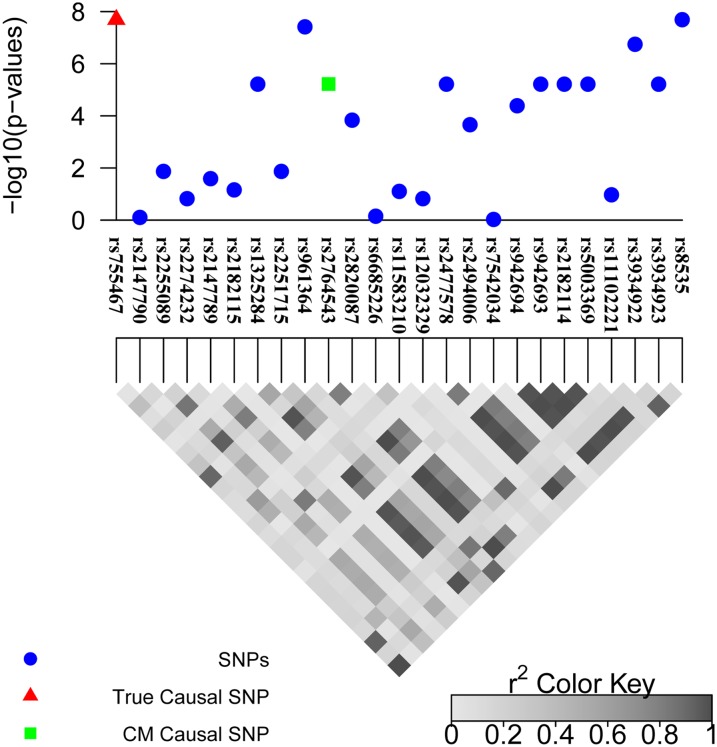
Although genome-wide association studies have successfully identified thousands of risk loci for complex traits, only a handful of the biologically causal variants, responsible for association at these loci, have been successfully identified. Current statistical methods for identifying causal variants at risk loci either use the strength of the association signal in an iterative conditioning framework or estimate probabilities for variants to be causal. A main drawback of existing methods is that they rely on the simplifying assumption of a single causal variant at each risk locus, which is typically invalid at many risk loci. In this work, we propose a new statistical framework that allows for the possibility of an arbitrary number of causal variants when estimating the posterior probability of a variant being causal. A direct benefit of our approach is that we predict a set of variants for each locus that under reasonable assumptions will contain all of the true causal variants with a high confidence level (e.g., 95%) even when the locus contains multiple causal variants. We use simulations to show that our approach provides 20-50% improvement in our ability to identify the causal variants compared to the existing methods at loci harboring multiple causal variants. We validate our approach using empirical data from an expression QTL study of CHI3L2 to identify new causal variants that affect gene expression at this locus. CAVIAR is publicly available online at http://genetics.cs.ucla.edu/caviar/.

Keywords: association studies; causal variants; fine mapping.


Figures

Figure 1
Figure 1
(A and B) Simulated data for two regions with different LD patterns that contain 35 SNPs. A and B are obtained by considering the 100 kbp upstream and downstream of rs10962894 and rs4740698, respectively, from the Wellcome Trust Case–Control Consortium study for coronary artery disease (CAD). (C and D) The rank of the causal SNP in additional simulations for the regions in A and B, respectively. We obtain these histograms from simulation data by randomly generating GWAS statistics using multivariate normal distribution. We apply the simulation 1000 times.
Figure 2
Figure 2
Simulated association with two causal SNPs. (A) The 100-kbp region around the rs10962894 SNP and simulated statistics at each SNP generated assuming two SNPs are causal. In this example SNP25 and SNP29 are considered as the causal SNPs. However, the most significant SNP is the SNP27. (B) The causal set selected by CAVIAR (our method) and the top k SNPs method. We ranked the selected SNPs based on the association statistics. The gray bars indicate the selected SNPs by both methods, the green bars indicate the selected SNPs by the top k SNPs method only, and the blue bars indicate the selected SNPs by CAVIAR only. The CAVIAR set consists of SNP17, SNP20, SNP21, SNP25, SNP26, SNP28, and SNP29. For the top k SNPs method to capture the two causal SNPs we have to set k to 11, as one of the causal SNPs is ranked 11th based on its significant score. Unfortunately, knowing the value of k beforehand is not possible. Even if the value of k is known, the causal set selected by our method excludes SNP30–SNP35 from the follow-up studies and reduces the cost of follow-up studies by 30% compared to the top k method.
Figure 3
Figure 3
Comparison of each method’s performance on the simulated GWAS data. (A) The recall rate for each method. (B) The number of causal SNPs selected by each method. CM is the conditional method and 1-Post is the method proposed by Maller et al. (2012). In both panels the x-axis is the true number of causal SNPs that we have implanted in each region. In the scenario of one causal SNP both our method and 1-Post have similar results as both methods use the 95% confidence interval to select a SNP as causal. However, for scenarios in which we have more than one causal SNP, our method outperforms 1-Post.
Figure 4
Figure 4
Comparison of recall rates. ECM and E1-Post are our extension of the CM and the 1-Post method, respectively, where we allow them to select the same number of causal SNPs as CAVIAR.
Figure 5
Figure 5
The recall rate compression for different methods while selecting the same number of causal SNPs. The x-axis is the number of SNPs selected by each method and the y-axis is the recall rate for each method. A, B, and C represent the scenarios where we have implanted one, two, and three causal SNPs, respectively. In the scenario of only one causal SNP CAVIAR, top k SNPs, and the 1-Post method obtain similar ranking for SNPs.
Figure 6
Figure 6
The 95% causal set selected by CAVIAR for the CHI3L2 region. The red triangle represents the true causal SNP that is known using experimental methods (Cheung et al. 2005) and the green square represents the causal SNP detected using the CM conditional on the true causal SNP (rs755467).

References

    1. Abecasis G., Altshuler D., Auton A., Brooks L., Durbin R., et al. , 2010. A map of human genome variation from population-scale sequencing. Nature 467(7319): 1061–1073 - PMC - PubMed
    1. Allen H. L., Estrada K., Lettre G., Berndt S. I., Weedon M. N., et al. , 2010. Hundreds of variants clustered in genomic loci and biological pathways affect human height. Nature 467(7317): 832–838 - PMC - PubMed
    1. Altshuler D., Daly M. J., Lander E. S., 2008. Genetic mapping in human disease. Science 322(5903): 881–888 - PMC - PubMed
    1. Bauer D. E., Kamran S. C., Lessard S., Xu J., Fujiwara Y., et al. , 2013. An erythroid enhancer of BCL11A subject to genetic variation determines fetal hemoglobin level. Science 342(6155): 253–257 - PMC - PubMed
    1. Beecham A. H., Patsopoulos N. A., Xifara D. K., Davis M. F., Kemppinen A., et al. , 2013. Analysis of immune-related loci identifies 48 new susceptibility variants for multiple sclerosis. Nat. Genet. 45(11): 1353–1360 - PMC - PubMed

Publication types