

The human gut microbiome as a screening tool for colorectal cancer
- PMID: 25104642
- PMCID: PMC4221363
- DOI: 10.1158/1940-6207.CAPR-14-0129
The human gut microbiome as a screening tool for colorectal cancer
Abstract
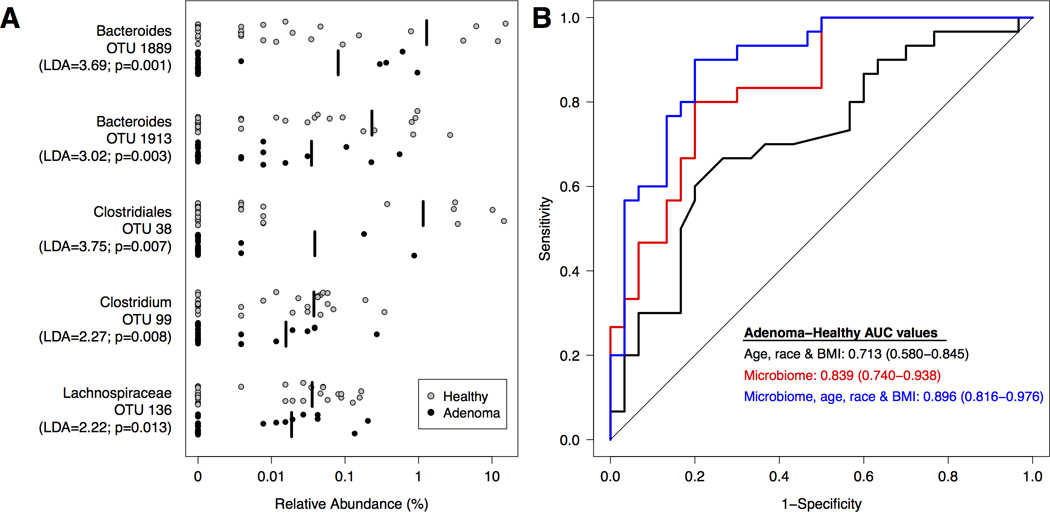
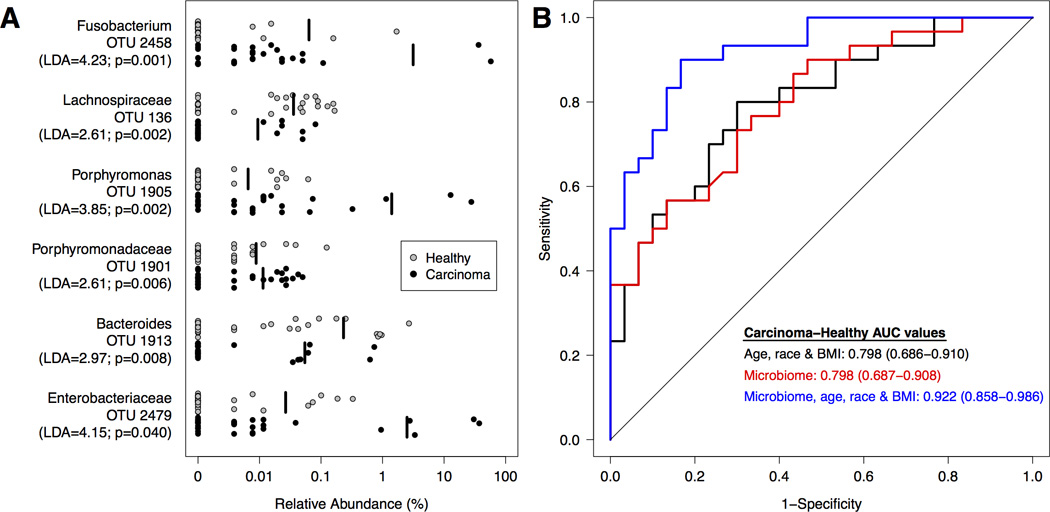
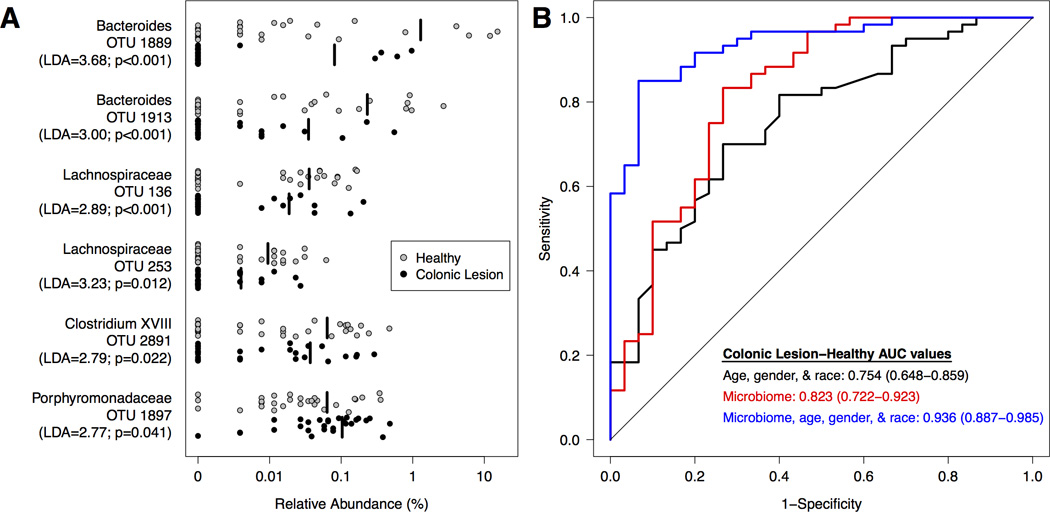
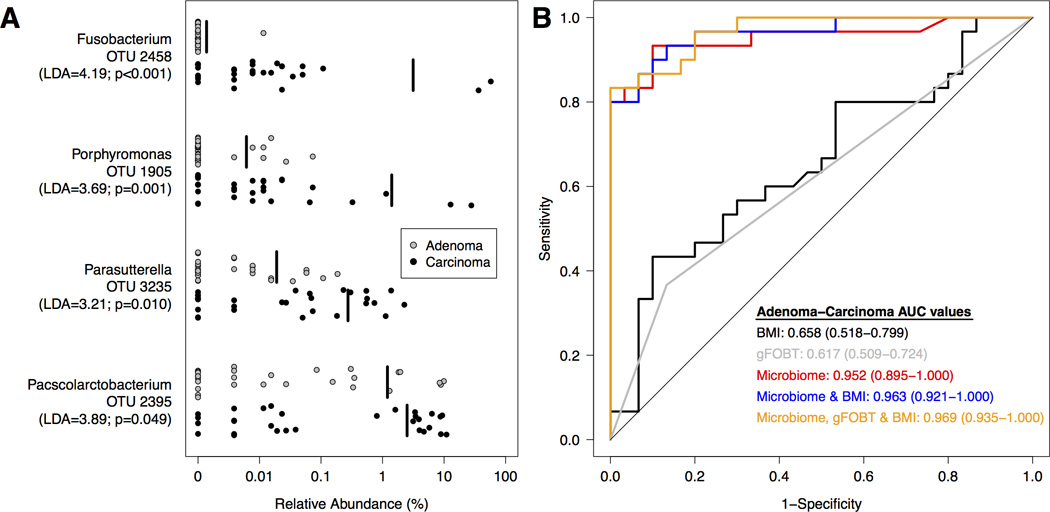
Recent studies have suggested that the gut microbiome may be an important factor in the development of colorectal cancer. Abnormalities in the gut microbiome have been reported in patients with colorectal cancer; however, this microbial community has not been explored as a potential screen for early-stage disease. We characterized the gut microbiome in patients from three clinical groups representing the stages of colorectal cancer development: healthy, adenoma, and carcinoma. Analysis of the gut microbiome from stool samples revealed both an enrichment and depletion of several bacterial populations associated with adenomas and carcinomas. Combined with known clinical risk factors of colorectal cancer (e.g., BMI, age, race), data from the gut microbiome significantly improved the ability to differentiate between healthy, adenoma, and carcinoma clinical groups relative to risk factors alone. Using Bayesian methods, we determined that using gut microbiome data as a screening tool improved the pretest to posttest probability of adenoma more than 50-fold. For example, the pretest probability in a 65-year-old was 0.17% and, after using the microbiome data, this increased to 10.67% (1 in 9 chance of having an adenoma). Taken together, the results of our study demonstrate the feasibility of using the composition of the gut microbiome to detect the presence of precancerous and cancerous lesions. Furthermore, these results support the need for more cross-sectional studies with diverse populations and linkage to other stool markers, dietary data, and personal health information.
©2014 American Association for Cancer Research.
Conflict of interest statement
Figures
Comment in
-
Human fecal microbiome-based biomarkers for colorectal cancer.Cancer Prev Res (Phila). 2014 Nov;7(11):1108-11. doi: 10.1158/1940-6207.CAPR-14-0273. Epub 2014 Sep 15. Cancer Prev Res (Phila). 2014. PMID: 25223933
References
-
- Parkin DM, Bray F, Ferlay J, Pisani P. Global cancer statistics, 2002. CA: a cancer journal for clinicians. 2005;55:74–108. - PubMed
-
- Fearon ER. Molecular genetics of colorectal cancer. Annual review of pathology. 2011;6:479–507. - PubMed
-
- Levin B, Lieberman DA, McFarland B, Smith RA, Brooks D, et al. Screening and surveillance for the early detection of colorectal cancer and adenomatous polyps, 2008: a joint guideline from the American Cancer Society, the US Multi-Society Task Force on Colorectal Cancer, and the American College of Radiology. CA: a cancer journal for clinicians. 2008;58:130–160. - PubMed
-
- Surveillance, Epidemiology, and End Results (SEER) National Cancer Institute, DCCPS, Surveillance Research Program, Surveillance Systems Branch; Program Research Data (1973–2010) released April 2013 based on the November 2012 submission ed:
-
- Whitlock EP, Lin JS, Liles E, Beil TL, Fu R. Screening for colorectal cancer: a targeted, updated systematic review for the U.S. Preventive Services Task Force. Annals of internal medicine. 2008;149:638–658. - PubMed
Publication types
MeSH terms
Substances
Grants and funding
LinkOut - more resources
Full Text Sources
Other Literature Sources
Medical
