. 2014 Jul 24:8:128.
doi: 10.3389/fnsys.2014.00128. eCollection 2014.

Development and matching of binocular orientation preference in mouse V1

Affiliations

Development and matching of binocular orientation preference in mouse V1

Basabi Bhaumik et al. Front Syst Neurosci. .

Abstract

Eye-specific thalamic inputs converge in the primary visual cortex (V1) and form the basis of binocular vision. For normal binocular perceptions, such as depth and stereopsis, binocularly matched orientation preference between the two eyes is required. A critical period of binocular matching of orientation preference in mice during normal development is reported in literature. Using a reaction diffusion model we present the development of RF and orientation selectivity in mouse V1 and investigate the binocular orientation preference matching during the critical period. At the onset of the critical period the preferred orientations of the modeled cells are mostly mismatched in the two eyes and the mismatch decreases and reaches levels reported in juvenile mouse by the end of the critical period. At the end of critical period 39% of cells in binocular zone in our model cortex is orientation selective. In literature around 40% cortical cells are reported as orientation selective in mouse V1. The starting and the closing time for critical period determine the orientation preference alignment between the two eyes and orientation tuning in cortical cells. The absence of near neighbor interaction among cortical cells during the development of thalamo-cortical wiring causes a salt and pepper organization in the orientation preference map in mice. It also results in much lower % of orientation selective cells in mice as compared to ferrets and cats having organized orientation maps with pinwheels.

Keywords: critical period for orientation matching; mouse V1; orientation map; orientation selectivity; receptive field alignment.


Figures

Figure 1
Figure 1
The three layered visual pathway model. We have modeled 40° of binocular and left monocular visual fields each as shown in (A). The left and the right eye retinae are 80 × 80 each. The left eye specific LGN layer is 80 × 80 with 40 × 80 region getting input from left monocular field and the rest 40 × 80 region from binocular field of vision. The right eye specific LGN layer is 40 × 80 and receives input from binocular field of vision. The cortical layer in the right hemisphere has left monocular and binocular regions of size 67 × 134 each. (B) The LGN layer for each eye has two sheets of cells each with center-surround structure—one for ON center and another for OFF center type cells. Each cortical cell in the left monocular region gets input from a 13 × 13 section of cells from the left eye specific LGN layer, whereas each cell in binocular region gets input from a 13 × 13 section of cells from both the left eye and the right eye specific LGN layers.
Figure 2
Figure 2
(A) Threshold value (mV) histograms for cortical cells in monocular (histogram on left) and binocular (histogram on right) regions are shown. The y-axis is the percentage of cells and x-axis is the threshold value in mV. (B) This is a scatter plot of observed binocular spike rate on y-axis and predicted binocular spike rate (as linear sum of individual left and right monocular spike rates) on x-axis for cortical cells in binocular region of cortex. The green line has a slope of 45° and the red line is the linear fit to data. The binocular spike rate is less than sum of individual monocular spike rates for higher spike rates. (C) Plots of β function of cells in monocular region (blue) and that in binocular region (red) (y-axis on left) with normalized input activation. β decreases as input activation increases. Plot for the threshold value (green) for all cortical cells with normalized input activation. Threshold value increases as input activation increases.
Figure 3
Figure 3
(A,B) The left and the right RFs for a 5 × 5 section of cortex in the binocular zone are shown at 500 epochs, and 3000 epoch. RFs are locally diverse where near-by neurons have largely dissimilar receptive fields. The ON and OFF subregions are shown in Gray-scale with white (black) color representing connections from ON (OFF) LGN cells. The shading is proportional to strength of connection from LGN cells. At 500, epochs the sub-field structure is found only in few cells. The left and the right RFs are not similar as sub region correspondence factor is not included before 500th epoch. At 3000, the sub-field structure is visible. Due to sub region correspondence factor acting between 500 and 3000 epochs, the left and the right RFs become similar. Black boxes are marked around RFs for cells which are oriented in left and right eyes individually and the orientation preference difference between the left and the right eyes is less than 30°.
Figure 4
Figure 4
(A) HWHH histogram of the left monocular, the right monocular, and the binocular responses for cortical cells in a 35 × 60 section inside the binocular region. There is a large chunk of cells which are poorly orientation tuned, but there is also a large number of cells with good orientation tuning. Tuning properties of monocular responses are better than binocular responses. (B) HWHH histogram for a 35 × 60 section of cells in the monocular region. (C) Scatter plot between HWHH and maximum spike rate (spikes/s) of binocular response for a 35 × 60 section of cells in the binocular region of the cortex.
Figure 5
Figure 5
(A) The spatial frequency response of 3 sample cells. The response at sample frequencies (0.01–0.06 cycles/° with intervals of 0.01 cycles/°) and velocity of 100°/s is fitted with cubic spline to determine optimal spatial frequency. Optimal spatial frequency for Cell 1–Cell 3 are 0.042 cycles/°, 0.022 cycles/°, and 0.048 cycles/°, respectively. (B) The Optimal spatial frequency histogram for all cells (N = 374) from a patch in binocular region that are oriented in left and right RFs and have ΔOR < 30°. (C) Optimal spatial frequency histogram for cells from (B) that also have moderate orientation tuning (OSI > 0.3). Mean in (C) is 0.038 cycles/°.
Figure 6
Figure 6
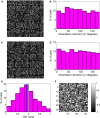
(A,C) Two orientation preference maps for a 32 × 32 section of cortex inside binocular region and monocular region, respectively. The lines depict orientation preference for cells. For cells that are not orientation tuned, no line is shown. We observe a salt and pepper orientation preference map. (B) Orientation preference histogram for binocular cells. (D) Orientation preference histogram for monocular cells. All orientations are almost equally present. (E) OD histogram of the cells in binocular region. Mean OD is −0.1031 and depicts contra-lateral dominance. (F) OD map for the section of the cortex shown in (A). The OD map is unstructured.
Figure 7
Figure 7
(A) HWHH histogram for the cells in a 35 × 60 patch from the binocular region in the cortex. The histograms are shown from 500 to 3000 epochs at an interval of 500 epoch. (B) Histograms of preferred orientation difference between the two eyes at (i) 500, (ii) 1500, and (iii) 2500 epochs. In (iv) the histograms in (i)(iii) are compared with uniform distribution (green line). Uniform distribution is the expected distribution of |ΔOR| when the left and right receptive fields develop independently. At 500 epochs, |ΔOR| distribution is almost uniform. There is not much improvement in |ΔOR| between 1500 and 2500 epochs.
Figure 8
Figure 8
(Ai–iii) Histogram of preferred orientation difference between the two eyes, ΔOR, at maturity (3000th epochs) for C-iter = 0, 500, and 1500 for cells from the same 35 × 60 patch of cortex used for Figure 7. (iv) The cumulative distribution of ΔOR, at 3000 epochs is shown for three different values of C-iter. The green line depicts uniform distribution. (B) The HWHH histograms for binocular oriented cells from the same patch of cells as in (A) for (i) C-iter = 0, (ii) C-iter = 500, and (iii) C-iter = 1500.
Figure 9
Figure 9
(A) The effect of extending the duration of critical period on RFs. The left eye and the right eye specific RFs for some sample cells are shown. The RFs shown on the left of the figure are for the left eye and those shown on the right are for the right eye. (B) The change in overall matching index for three different values of C-iter—500, 1500, and 2500 epochs, respectively.
Figure 10
Figure 10
HWHH histogram in model cat cortex, (A) in absence, and (B) in presence of diffusive cooperation among cortical cells.

Similar articles

Cited by

References

    1. Ackman J. B., Burbridge T. J., Crair M. C. (2012). Retinal waves coordinate patterned activity throughout the developing visual system. Nature 490, 219–225 10.1038/nature11529 - DOI - PMC - PubMed
    1. Bhaumik B., Mathur M. (2003). A cooperation and competition based simple cell receptive field model and study of feed-forward linear and nonlinear contributions to orientation selectivity. J. Comp. Neurosci. 14, 211–227 10.1023/A:1021911019241 - DOI - PubMed
    1. Bi G. Q., Poo M. M. (2001). Synaptic modification by correlated activity: hebb's postulate revisited. Annu. Rev. Neurosci. 24, 139–166 10.1146/annurev.neuro.24.1.139 - DOI - PubMed
    1. Bishop P. O., Henry G. H. (1972). Striate neurones: receptive field concepts. Invest. Ophthalmol. 11, 346–354 - PubMed
    1. Blakemore C., Florentini A., Maffei L. (1972). A second neural mechanism of binocular depth discrimination. J. Physiol. 226, 725–749 - PMC - PubMed

LinkOut - more resources