. 2014 Oct 27;20(1):417-26.
doi: 10.2119/molmed.2014.00054.

Regulation of autophagy by α1-antitrypsin: "a foe of a foe is a friend"

Affiliations

Regulation of autophagy by α1-antitrypsin: "a foe of a foe is a friend"

Michal G Shapira et al. Mol Med. .

Abstract

Autophagy is involved in both the cell protective and the cell death process but its mechanism is largely unknown. The present work unravels a novel intracellular mechanism by which the serpin α1-antitrypsin (AAT) acts as a novel negative regulator of autophagic cell death. For the first time, the role of intracellularly synthesized AAT, other than in liver cells, is demonstrated. Autophagic cell death was induced by N-α-tosyl-L-phenylalanine chloromethyl ketone (TPCK) and tamoxifen. By utilizing a fluorescently tagged TPCK analog, AAT was "fished out" (pulled out) as a TPCK intracellular protein target. The interaction was further verified by competition binding experiments. Both inducers caused downregulation of AAT expression associated with activation of trypsin-like proteases. Furthermore, silencing AAT by siRNA induced autophagic cell death. Moreover, AAT administration to cultured cells prevented autophagic cell death. This new mechanism could have implications in the treatment of diseases by the regulation of AAT levels in which autophagy has a detrimental function. Furthermore, the results imply that the high synthesis of endogenous AAT by cancer cells could provide a novel resistance mechanism of cancer against autophagic cell death.


Figures
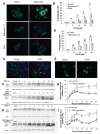
Figure 1
Figure 1
TPCK induces autophagy. TPCK-induced autophagy is evident by fluorescence microscopy: (A) MCF-7 and (C) HT-29 cells treated with TPCK, with or without 3MA (5 mmol/L) or bafilomycin A1 (50 nmol/L) for 24 h, and stained with MDC; magnification 40×. The quantification of the results obtained with (B) MCF-7 and (D) HT-29 cells, mean ± SE of at least four independent experiments. (E) Images of GFP-LC3 transfected MCF-7 cells treated with TPCK (50 μmol/L) for 24 h. (F,G) MCF-7 and (H, I) HT-29 cells treated with TPCK (50 μmol/L) for different times, and LC3-II levels were analyzed by Western blots. *P < 0.05, **P < 0.01, #P < 0.001, compared with control, by Student t test.
Figure 2
Figure 2
TPCK causes autophagic cell death and not apoptosis. Autophagy in MCF-7 cells was induced by treatment with (A) 50 μmol/L TPCK for 24 h or (B) 5 μmol/L tamoxifen for 72 h. 30 min before the autophagy induction the cells were treated with 50 nmol/L bafilomycin A1 or 5 mmol/L 3-methyladenine or with combination of 10 μg/mL pepstatin and 10 μg/mL E64-d. Cell viability was assessed by trypan blue staining (expressed by percentage of viability of DMSO-treated cells [n = 3]) *P < 0.02 as compared with DMSO-treated respective controls. (C) Fluorescence microscopy analysis of AO/EB staining, magnification 40×. (D) Quantification of AO/EB-stained cells treated with different concentrations of TPCK for 24 h. Flow cytometry analysis of (E) cell cycle and (F) annexin V-FITC of MCF-7 cells treated with control DMSO or TPCK (50 μmol/L) for 24 h.
Figure 3
Figure 3
FLISP induces autophagy. TRFCK induces autophagy as seen by fluorescence microscopy of MDC-labeled and TRFCK-treated (10 μmol/L) MCF-7 cells (A). Flow cytometry analysis of FSFCK-treated (10 μmol/L) MCF-7 cells (B). *P < 0.05, compared with time 0, by Student t test.
Figure 4
Figure 4
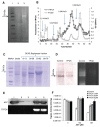
The fishing out of AAT. Lysates of control and TPCK-treated (50 μmol/L, 1 h) MCF-7 cells were incubated with TRFCK (50 μmol/L, 30 min) followed by purificating the fluorescently labeled protein. (A) UV analysis of SDS-PAGE of control lysate, precipitated with 40% ammonium sulfate: lane 1, marker; lane 2, lysate; lane 3, precipitated proteins. (B) Elution profile of DEAE-sepharose column of the precipitate of the control lysate. (C) Coomassie blue analysis of the concentrated fractions from DEAE-sepharose column of the control lysate. (D) Coomassie blue and UV analysis of control and TPCK-treated lysate after the final affinity column. TRFCK binds in vitro covalently to AAT as analyzed by immunoblot and UV; AAT (50 μg/mL) was incubated first with tamoxifen (0.5 mmol/L, 30 min) followed by incubation with TRFCK (50 μmol/L, 30 min): lane 1, denatured AAT + TRFCK; lane 2, TRFCK; lane 3, tamoxifen; lane 4, AAT + TRFCK; lane 5, AAT + tamoxifen + TRFCK (E). TPCK inhibits AAT inhibition of trypsin as measured by enzymatic assay (F). *P < 0.001, compared with control, by Student t test.
Figure 5
Figure 5
AAT modulates autophagy. AAT is downregulated by TPCK (50 μmol/L) and tamoxifen (10 μmol/L) in (A,B) MCF-7 and (C,D) HT-29 cells, detected by immunoblotting. AAT silencing causes autophagy induction. (E,F) MCF-7 cells were transfected with siRNAs, and LC3-II and AAT levels analyzed by immunoblotting. AAT inhibits autophagic cell death induced by TPCK (50 μmol/L, 24 h) or tamoxifen (5 μmol/L, 72 h) in MCF-7 cells as (G) seen and (F) analyzed by fluorescence microscopy and measured by trypan blue staining (I). magnification 40×. Data represent mean ± SE of at least three independent experiments. *P < 0.05, **P < 0.01, ***P < 0.001 (versus control); #P < 0.05; ##P < 0.01 (versus without AAT), by the Student t test.
Figure 6
Figure 6
TPCK and tamoxifen induce trypsin-like activity. Zymography using fluorescent trypsin substrate of the lysate obtained from TPCK-treated MCF-7 cells (A). Time dependence of the colorimetric assay for trypsin-like protease activity of lysate obtained from tamoxifen-treated (10 μmol/L) MCF-7 cells with or without TLCK (50 μmol/L) in the assay (B). Data represent mean ± SE of at least three independent experiments. *P < 0.05, compared with time 0, by Student t test.

References

    1. Codogno P, Meijer AJ. Autophagy and signaling: their role in cell survival and cell death. Cell Death Differ. 2005;12(Suppl 2):1509–18. - PubMed
    1. Klionsky DJ, Emr SD. Autophagy as a regulated pathway of cellular degradation. Science. 2000;290:1717–21. - PMC - PubMed
    1. Shintani T, Klionsky DJ. Autophagy in health and disease: a double-edged sword. Science. 2004;306:990–5. - PMC - PubMed
    1. Levine B, Kroemer G. Autophagy in the pathogenesis of disease. Cell. 2008;132:27–42. - PMC - PubMed
    1. Chen N, Karantza V. Autophagy as a therapeutic target in cancer. Cancer Biol Ther. 2011;11:157–68. - PMC - PubMed

Publication types