Clinical Trial

FCGR2C polymorphisms associate with HIV-1 vaccine protection in RV144 trial

Shuying S Li et al. J Clin Invest. 2014 Sep.

Abstract

The phase III RV144 HIV-1 vaccine trial estimated vaccine efficacy (VE) to be 31.2%. This trial demonstrated that the presence of HIV-1-specific IgG-binding Abs to envelope (Env) V1V2 inversely correlated with infection risk, while the presence of Env-specific plasma IgA Abs directly correlated with risk of HIV-1 infection. Moreover, Ab-dependent cellular cytotoxicity responses inversely correlated with risk of infection in vaccine recipients with low IgA; therefore, we hypothesized that vaccine-induced Fc receptor-mediated (FcR-mediated) Ab function is indicative of vaccine protection. We sequenced exons and surrounding areas of FcR-encoding genes and found one FCGR2C tag SNP (rs114945036) that associated with VE against HIV-1 subtype CRF01_AE, with lysine at position 169 (169K) in the V2 loop (CRF01_AE 169K). Individuals carrying CC in this SNP had an estimated VE of 15%, while individuals carrying CT or TT exhibited a VE of 91%. Furthermore, the rs114945036 SNP was highly associated with 3 other FCGR2C SNPs (rs138747765, rs78603008, and rs373013207). Env-specific IgG and IgG3 Abs, IgG avidity, and neutralizing Abs inversely correlated with CRF01_AE 169K HIV-1 infection risk in the CT- or TT-carrying vaccine recipients only. These data suggest a potent role of Fc-γ receptors and Fc-mediated Ab function in conferring protection from transmission risk in the RV144 VE trial.


Figures

Figure 5
Figure 5. Comparisons of IgG and IgG3 V1V2 breadth scores to V1V2 scaffold antigens (labeled median IgG/IgG3 response to V1V2) and of IgG and IgG3 to the A244 and AE703357 gp120 antigens at week 26 between the uninfected vaccine recipients and CRF01_AE 169K HIV-1–infected vaccine recipients within each of the 2 genotype subgroups of FCGR2C 126C>T (rs114945036).
The V1V2 breadth score for an individual was defined as the median of IgG or IgG3 responses to the 11 V1V2 scaffold antigens. Each immune response variable was standardized to have mean 0 and SD of 1. Box plots show the 25th percentile (left edge of the box), 50th percentile (vertical line in the box), and 75th percentile (right edge of the box), and vertical whiskers extend no more than 1.5 times the height of the box; individual outliers beyond the whiskers are plotted. Green, gray, and red data points indicate the tertiles of response (low, medium, and high, respectively). P values for comparing immune response variables are from the Wilcoxon rank-sum test. The 2 CRF01_AE 169K HIV-1–infected vaccine recipient cases in the CT/TT genotype group had uniformly low immune responses of all types, with significantly lower responses for IgG and IgG3 to the A244 and AE703357 gp120s compared with those for the CT/TT uninfected vaccine recipients.
Figure 4
Figure 4. Comparisons of IgA-binding Abs, IgG-binding Abs, IgG avidity, and NAbs at week 26 between the uninfected vaccine recipients (controls) and CRF01_AE 169K HIV-1–infected vaccine recipients (169K cases) within each of the 2 genotype subgroups of FCGR2C 126C>T (rs114945036).
Each immune response variable was standardized to have mean 0 and SD of 1. Box plots show the 25th percentile (left edge of the box), 50th percentile (vertical line in the box), and 75th percentile (right edge of the box), and vertical whiskers extend no more than 1.5 times the height of the box; individual outliers beyond the whiskers are plotted. Green, gray, and red data points indicate the tertiles of response (low, medium, and high, respectively). P values for comparing immune response variables (except IgA C1 peptide and IgA consensus A gp140) are from the Wilcoxon rank-sum test and for comparing response rates of IgA C1 peptide and IgA consensus A gp140 are from Fisher’s exact test. The 2 CRF01_AE 169K HIV-1–infected vaccine recipient cases in the CT/TT genotype group had uniformly low immune responses of all types, with significantly lower responses for IgG avidity and NAbs compared with those for the CT/TT uninfected vaccine recipients.
Figure 3
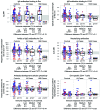
Figure 3. Distribution of the 6 primary immune response variables at week 26 in vaccine recipients, cross-classified by CC versus CT/TT genotypes of FCGR2C 126C>T (rs114945036) and case-control status.
Box plots show the 25th percentile (lower edge of the box), 50th percentile (horizontal line in the box), and 75th percentile (upper edge of the box), and vertical whiskers extend no more than 1.5 times the height of the box; individual outliers beyond the whiskers are plotted. Sex is indicated by color (men in blue and women in red), and tertile of response is indicated by point shading, where the gray horizontal bands represent the middle third of response values. The percentages of low, medium, and high tertile immune responses in CC and CT/CT control vaccine recipients are displayed below each panel of box plots. P values for testing different responses between CC and CT/TT control vaccine recipients are from Wilcoxon rank-sum tests. AUC-MB, area under the curve of magnitude and breadth.
Figure 2
Figure 2. Sieve effects (differential VE against CRF01_AE HIV-1 strains matching versus mismatching the vaccine insert).
Sieve effects at (A) amino acid position 169 and (B) amino acid position 181 of the HIV-1 V2 Env were assessed within each of the 2 genotype subgroups of FCGR2C 126C>T (rs114945036). The error bars are 95% confidence intervals. The P values in the graphs are for comparing genotype-specific VE between and within the CC and CT/TT subgroups. The sieve effect at position 169 differed between the CC and CT/TT subgroups (interaction P = 0.04 at the bottom of A).
Figure 1
Figure 1. Association of FCGR2C 126C>T (rs114945036) genotype with VE against any HIV-1 strain and VE against CRF01_AE 169K HIV-1.
The error bars are 95% confidence intervals for VE.

References

    1. Rerks-Ngarm S, et al. Vaccination with ALVAC and AIDSVAX to prevent HIV-1 infection in Thailand. N Engl J Med. 2009;361(23):2209–2220. doi: 10.1056/NEJMoa0908492. - DOI - PubMed
    1. Haynes BF, et al. Immune-correlates analysis of an HIV-1 vaccine efficacy trial. N Engl J Med. 2012;366(14):1275–1286. doi: 10.1056/NEJMoa1113425. - DOI - PMC - PubMed
    1. Zolla-Pazner S, et al. Analysis of V2 antibody responses induced in vaccinees in the ALVAC/AIDSVAX HIV-1 vaccine efficacy trial. PLoS One. 2013;8(1):e53629. doi: 10.1371/journal.pone.0053629. - DOI - PMC - PubMed
    1. Zolla-Pazner S, et al. Vaccine-induced IgG antibodies to V1V2 regions of multiple HIV-1 subtypes correlate with decreased risk of HIV-1 infection. PLoS One. 2014;9(2):e87572. doi: 10.1371/journal.pone.0087572. - DOI - PMC - PubMed
    1. Tomaras GD, et al. Vaccine-induced plasma IgA specific for the C1 region of the HIV-1 envelope blocks binding and effector function of IgG. Proc Natl Acad Sci U S A. 2013;110(22):9019–9024. doi: 10.1073/pnas.1301456110. - DOI - PMC - PubMed

Publication types

MeSH terms