. 2014 Sep;124(9):4067-81.
doi: 10.1172/JCI76175. Epub 2014 Aug 8.

Splice-correcting oligonucleotides restore BTK function in X-linked agammaglobulinemia model

Splice-correcting oligonucleotides restore BTK function in X-linked agammaglobulinemia model

Burcu Bestas et al. J Clin Invest. 2014 Sep.

Abstract

X-linked agammaglobulinemia (XLA) is an inherited immunodeficiency that results from mutations within the gene encoding Bruton's tyrosine kinase (BTK). Many XLA-associated mutations affect splicing of BTK pre-mRNA and severely impair B cell development. Here, we assessed the potential of antisense, splice-correcting oligonucleotides (SCOs) targeting mutated BTK transcripts for treating XLA. Both the SCO structural design and chemical properties were optimized using 2'-O-methyl, locked nucleic acid, or phosphorodiamidate morpholino backbones. In order to have access to an animal model of XLA, we engineered a transgenic mouse that harbors a BAC with an authentic, mutated, splice-defective human BTK gene. BTK transgenic mice were bred onto a Btk knockout background to avoid interference of the orthologous mouse protein. Using this model, we determined that BTK-specific SCOs are able to correct aberrantly spliced BTK in B lymphocytes, including pro-B cells. Correction of BTK mRNA restored expression of functional protein, as shown both by enhanced lymphocyte survival and reestablished BTK activation upon B cell receptor stimulation. Furthermore, SCO treatment corrected splicing and restored BTK expression in primary cells from patients with XLA. Together, our data demonstrate that SCOs can restore BTK function and that BTK-targeting SCOs have potential as personalized medicine in patients with XLA.


Figures

Figure 9
Figure 9. SCO-induced BTK restoration in patient monocytes.
(A) Results from RT-PCR 48 hours after electroporation of monocytes from a patient with XLA with the intron 4 mutation. Monocytes were transfected with 1 μM 186.15-3LNA. Human control monocytes were also included. Ribosomal RNA (18S) serves as an RNA quality control. (B) Western blot showing BTK protein 48 hours after electroporation with or without treatment with 1 μM 186.15-3LNA. The right lane with a mouse B cell sample serves as a positive control for BTK (mouse and human BTK protein are both composed of 659 amino acids and recognized by the same antiserum). (C) RT-PCR results from patient monocytes treated with B-PMO 186.25 (3 μM and 6 μM). (D) Western blot showing BTK protein from B-PMO 186.25– and PMO 186.25–treated patient monocytes. Note that the anti-BTK antibody used for the monocyte lysates generates a strong, nonspecific band appearing just below the BTK-specific band, while the specific band is completely absent from the nontreated patient control cells (lane 1). Actin served as a loading control. Representative gels from 3 independent experiments are shown. The lanes separated by a black line were run on a different gel. The percentage of WT BTK RNA was calculated as WT RNA fraction × 100/(misspliced + WT RNA fraction). The bar graphs show the quantitative analysis of BTK protein as a percentage of relative intensity according to ImageJ Software. MΦ, monocytes.
Figure 8
Figure 8. Restoration of BTK expression upon splice correction after in vivo treatment of BAC transgenic mice.
Four mice were treated with B-PMOs, as described in Methods, and assayed for BTK restoration. (A) RT-PCR analysis of total spleen and total bone marrow cells from B-PMO–treated transgenic mice. A representative gel from 2 animals, both from the treated and the untreated group, is shown. “WT-2” represents RNA from normal mice, and the slightly smaller amplicon in this lane results from a differential primer set discriminating human and mouse RNA. To ascertain the detection of corrected transcripts for samples from treated and untreated BAC transgenic animals, we decided to use 3 times more cDNA and 5 more amplification cycles. (B) Western blot analysis of BTK restoration in 2 of 4 treated animals; total cells from bone marrow and spleen. (C) Western blot analysis of the isolated B cells both from spleens and bone marrow, showing BTK expression from 2 representative animals. The percentage of WT BTK RNA was calculated as WT RNA fraction × 100/(misspliced + WT RNA fraction). Bar graphs show the quantitative analysis of BTK protein as a percentage of relative intensity according to ImageJ Software. T, treated.
Figure 7
Figure 7. Restoration of BTK protein expression after splice correction in pro–B cells from BAC transgenic mice.
Cells were electroporated with the 186.15-3LNA SCO. After 48 hours, cells were stained with anti-CD19 and anti-BTK (recognizing both mouse and human protein) for FACS analysis. Numbers in the 3 right upper quadrants indicate the percentage of CD19-positive and BTK-positive cells. The experiment was repeated twice with a similar outcome, and a representative result is presented.
Figure 6
Figure 6. B-PMO–mediated restoration of BTK mRNA and protein in primary spleen B cells from human BAC transgenic mice.
Cells were treated with PMO 186.25 or B-PMO 186.25 in different concentrations. “Scr” indicates a B-PMO SCO for an unrelated target (DMD). (A) RT-PCR products from SCO-treated B cells at 1 and 3 μM concentrations. Ribosomal RNA (18S) serves as an RNA quality control. Of note, for the splenocytes derived from WT mice, a different primer set selective for mouse Btk was used. The percentage of WT BTK RNA was calculated as WT RNA fraction × 100/(misspliced + WT RNA fraction). (B) Western blot from the same treatment. Experiments were repeated 3 times, and representative gels are depicted. Of note, for this experiment, anti-BTK from BD (see Methods) was used, yielding different unspecific bands. The bottom band originates from BTK, while the top band is unspecific. The lanes separated by a black line were run on the same gel, but since some lanes were considered uninformative, they were omitted as indicated by the black line. The bar graph shows the quantitative analysis of BTK protein as a percentage of relative intensity signal according to ImageJ Software. Scr, treated with scrambled ON.
Figure 5
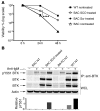
Figure 5. Enhanced survival and anti-IgM–induced BTK tyrosine phosphorylation in SCO-treated BAC transgenic B cells.
(A) Spleen B cells from BAC transgenic mice were treated with 3.2 μM SCO (186.15-3LNA or scrambled control) and stimulated with 20 μg/ml anti-IgM 48 hours after electroporation (time 0). Cells were counted, and viability was determined by trypan blue exclusion 24 and 48 hours after stimulation. The initial number of cells from both WT and BAC transgenic mice was 2 × 10⁶. Data represent 2 independent experiments with duplicates. Note that nontreated and scrambled ON–treated cell numbers overlap. Statistical significance was analyzed by using 1-way ANOVA followed by Bonferroni’s multiple-comparison test. ****P ≤ 0.0001 for BAC SCO treated versus BAC Scr and NT at 24 hours. (B) Analysis of BTK tyrosine phosphorylation after 3.2 μM SCO (186.15-3LNA) treatment and anti-IgM stimulation (20 μg/ml). Blots show pY551 phosphorylation of BTK and total BTK. Whole cell lysate (WCL) analysis shows BTK protein and actin. Each duplicate (–/+) corresponds to starved or anti-IgM–activated conditions. A representative blot is shown from 2 independent experiments. Note that the higher molecular weight band, located immediately above the pY551-BTK band in activated samples (IP pY551 gel), is of unknown origin and unrelated to BTK, since it also exists in B cells obtained from Btk KO mice following stimulation. The bar graph shows the quantitative analysis of Y551 phosphorylation as a percentage of relative intensity signal from the blots according to ImageJ Software.
Figure 4
Figure 4. Full-length human mutated BTK pre-mRNA corrected by SCOs yielding normal-sized transcripts and detectable BTK protein.
(A) B cells from human BAC transgenic mice were treated with 1.6 μM or 3.2 μM 186.15-3LNA SCO and analyzed by RT-PCR. To identify human RNA in cells from BAC transgenic and KO mice, a primer pair only detecting human BTK was used. To measure endogenous mouse Btk mRNA levels in splenocytes derived from WT mice, a different primer set selective for mouse Btk was used. A representative gel from 3 independent experiments is shown. Ribosomal RNA (18S) was used as an RNA quality control. (B) FACS analysis of cells 48 hours after treatment with 186.15-3LNA. B cells were stained with antibodies directed against CD19 or BTK protein (recognizing both mouse and human protein). Histograms for BTK expression in each sample from a representative experiment as well as the percentage of corrected cells from 3 independent experiments are shown (mean + SD). A concentration of 3.2 μM was used for the scrambled control SCO (Table 1). Mean fluorescence intensity, WT NT: 2,314; BAC SCO treated: 1,210. Percentage of WT BTK RNA was calculated as WT RNA fraction × 100/(misspliced + WT RNA fractions).
Figure 3
Figure 3. Splice correction–induced upregulation of reporter minigene activity following naked uptake of SCOs.
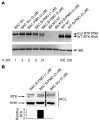
SCOs from the 186 series, including PMO 186.25, with and without the CPP moiety (B-PMO 186.25), were tested, and activity was measured as restoration of mRNA. A concentration of 6 μM was used for the scrambled control SCO (Scr) (Table 1). A representative gel from 2 independent experiments is shown.
Figure 2
Figure 2. Splice correction–induced upregulation of reporter minigene activity.
The U2OS cell line stably carrying a minigene interrupted by the mutated BTK intron 4 was transfected with different SCOs, and efficacy was measured as luciferase activity or mRNA restoration. (A) The relative luciferase activity in comparison to nontreated cells (mock) 24 hours after SCO transfection. “705” indicates an unrelated control SCO, targeting position 705 of a mutated β-globin intron, not complementary to the BTK pre-mRNA. All tested SCOs are 2′OMePS based (Table 1). Data represent mean + SD of 3 independent experiments, each with 2 replicates. **P ≤ 0. 01, ***P ≤ 0.001, versus 705. (B) Increase in luciferase activity by 2′OMePS-modified SCOs versus LNA SCOs is presented as fold increase over nontreated cells (mock). Graph represents mean + SD of 3 independent experiments, each with 2 replicates. **P ≤ 0. 01, ****P ≤ 0.0001, 186.18 versus 186.15-5LNA. (C) Total RNA RT-PCR showing the 389-bp and 271-bp bands corresponding to aberrant and corrected (with BTK intron 4 excised) mRNA bands, respectively, with a lower band of ribosomal RNA (18S) serving as an RNA quality control. The lane on the right represents RNA input from nontreated (NT) cells. “Scr” represents the control LNA/2′OMePS SCO not complementary to the reporter gene sequence (Table 1). A representative gel from 2 independent experiments is shown. Statistical significance was determined using 1-way ANOVA, followed by Bonferroni’s multiple-comparison test.
Figure 1
Figure 1. Design of SCOs using bioinformatic tools to search for ESE sites in the disease-causing pseudoexon.
(A) Three different algorithms from the corresponding web-based servers, ESE-Finder, RESCUE-ESE, and PESX, were used, and the hits were aligned to the pseudoexon sequence to find locations with the highest correlation between algorithms. SCOs targeting the probable ESE regions were subsequently designed. SCOs are schematically presented with their binding-positions along the pseudoexon. (B) Predicted outcome of splicing, with or without SCOs, indicated schematically.

References

    1. Berglof A, Turunen JJ, Gissberg O, Bestas B, Blomberg KE, Smith CI. Agammaglobulinemia: causative mutations and their implications for novel therapies. Expert Rev Clin Immunol. 2013;9(12):1205–1221. doi: 10.1586/1744666X.2013.850030. - DOI - PubMed
    1. Conley ME, et al. Primary B cell immunodeficiencies: comparisons and contrasts. Annu Rev Immunol. 2009;27:199–227. doi: 10.1146/annurev.immunol.021908.132649. - DOI - PubMed
    1. Mohamed AJ, et al. Bruton’s tyrosine kinase (Btk): function, regulation, and transformation with special emphasis on the PH domain. Immunol Rev. 2009;228(1):58–73. doi: 10.1111/j.1600-065X.2008.00741.x. - DOI - PubMed
    1. Vetrie D, et al. The gene involved in X-linked agammaglobulinaemia is a member of the src family of protein-tyrosine kinases. Nature. 1993;361(6409):226–233. doi: 10.1038/361226a0. - DOI - PubMed
    1. Tsukada S, et al. Deficient expression of a B cell cytoplasmic tyrosine kinase in human X-linked agammaglobulinemia. Cell. 1993;72(2):279–290. doi: 10.1016/0092-8674(93)90667-F. - DOI - PubMed

Publication types

Supplementary concepts