Comparative Study
. 2014 Aug 8;9(8):e100868.
doi: 10.1371/journal.pone.0100868. eCollection 2014.

Vitamin A and feeding statuses modulate the insulin-regulated gene expression in Zucker lean and fatty primary rat hepatocytes

Affiliations
Comparative Study

Vitamin A and feeding statuses modulate the insulin-regulated gene expression in Zucker lean and fatty primary rat hepatocytes

Wei Chen et al. PLoS One. .

Abstract

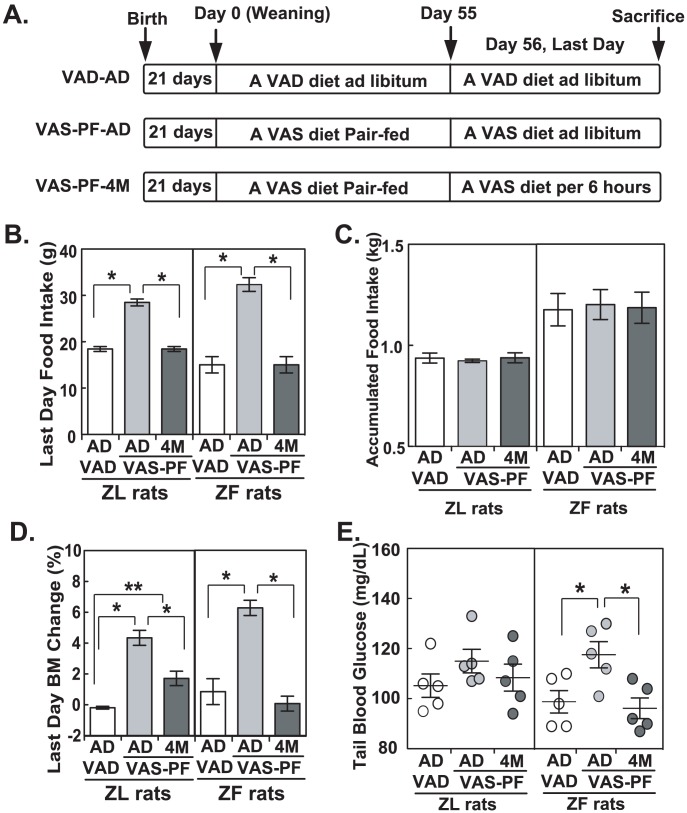
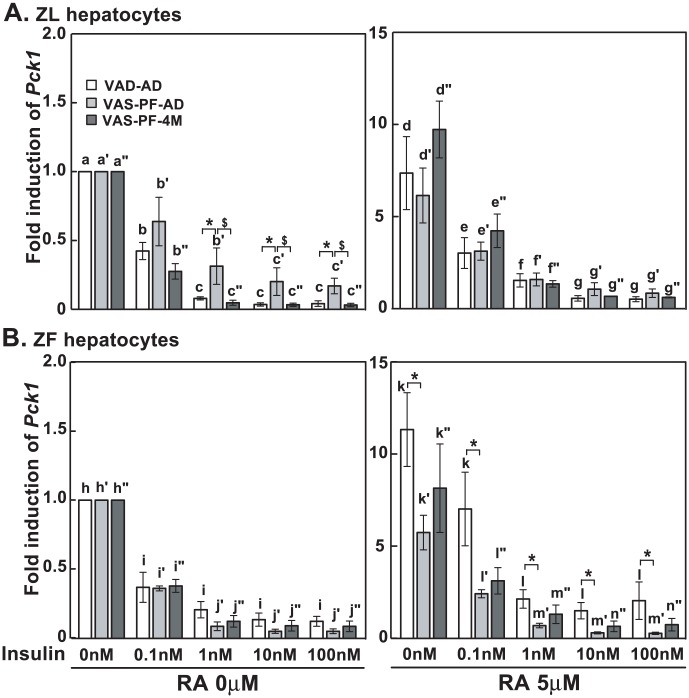
Unattended hepatic insulin resistance predisposes individuals to dyslipidemia, type 2 diabetes and many other metabolic complications. The mechanism of hepatic insulin resistance at the gene expression level remains unrevealed. To examine the effects of vitamin A (VA), total energy intake and feeding conditions on the insulin-regulated gene expression in primary hepatocytes of Zucker lean (ZL) and fatty (ZF) rats, we analyze the expression levels of hepatic model genes in response to the treatments of insulin and retinoic acid (RA). We report that the insulin- and RA-regulated glucokinase, sterol regulatory element-binding protein-1c and cytosolic form of phosphoenolpyruvate carboxykinase expressions are impaired in hepatocytes of ZF rats fed chow or a VA sufficient (VAS) diet ad libitum. The impairments are partially corrected when ZF rats are fed a VA deficient (VAD) diet ad libitum or pair-fed a VAS diet to the intake of their VAD counterparts in non-fasting conditions. Interestingly in the pair-fed ZL and ZF rats, transient overeating on the last day of pair-feeding regimen changes the expression levels of some VA catabolic genes, and impairs the insulin- and RA-regulated gene expression in hepatocytes. These results demonstrate that VA and feeding statuses modulate the hepatic insulin sensitivity at the gene expression level.


Conflict of interest statement

Competing Interests: The authors have declared that no competing interests exist.

Figures

Figure 1
Figure 1. Impaired insulin-regulated gene expression in primary hepatocytes of ZF rats fed chow ad libitum.
ZL and ZF rats were fed standard chow for eight weeks before primary hepatocytes were harvested. The primary hepatocytes were incubated in medium A with increasing concentrations of insulin (0 nM to 100 nM) in the absence or presence of RA (5 µM) for 6 hours. Total RNA was extracted, synthesized into cDNA, and then subjected to real-time PCR analysis for the expression levels of Gck (A), Pck1 (B), Srebp-1c (C), and Pklr (D). The expression level of each gene transcript in ZL or ZF hepatocytes treated with vehicle control was arbitrarily set to 1. The data were expressed as fold induction. The numbers of hepatocyte isolation are presented in parenthesis. All p<0.05; for (A), a′<b′<c′, a<b<c, d′<e′, d<e; for (B), f′>g′>h′, f>g>h, i′>j′, i>k; for (C), l′<m′<n′, m<o, p′<q′, r<s using one-way ANOVA; * or # for comparing ZL or ZF at corresponding treatments using Student's t-test, respectively.
Figure 2
Figure 2. VAD diet partially recovered the impaired insulin-regulated gene expression in ZF primary rat hepatocytes.
ZL and ZF rats were fed either a VAS or VAD diet for 8 weeks. Primary hepatocytes were isolated from rats in ad libitum. Cells were incubated in medium A with increasing concentrations of insulin (0 nM to 100 nM) in the absence or presence of RA (5 µM) for 6 hours. Total RNA was extracted, synthesized into cDNA, and then subjected to real-time PCR analysis for the expression levels of Gck (A), Pck1 (B), and Srebp-1c (C). The data were expressed as fold induction. The gene transcript levels from the no treatment group (0 nM insulin, no RA) for both ZL and ZF were arbitrarily set to 1. The numbers of hepatocyte isolation are presented in parenthesis. All p<0.05; for (A), a<b<c, d<e<f, g<h<i, j<k<l, m<o, p<r/s/t, q<s/t, r<t, x<y; for (B), a′>b′>c′, d′>e′>f′, g′>h′>i, j′>k′>l′, m′>n′, o′>q′/r′, p′>r′, s′>t′>u′, v′>x′/y′, w′>y′; for (C), a″<b″<c″, d″<e″<f″, h″<i″<j″, k″<m″, n″<p″, q″<s″, using one-way ANOVA. * or # for comparing ZL and ZF at corresponding treatments using Student's t-test, respectively.
Figure 3
Figure 3. VAS-PF-AD ZL and ZF overate on the last day when sufficient VAS diet was provided.
(A) The schematic graph of the setup for the pair-feeding regimen. VAD ad libitum (VAD-AD, n = 5), VAS pair-feeding last day ad libitum (VAS-PF-AD, n = 5), VAS pair-feeding last day 4 meals (VAS-PF-4M, n = 5) (B) Tail tip whole blood glucose from ZL and ZF rats before sacrifice. Each circle represents a value from an individual animal. The bars represent mean ± S.E.M. * Indicates p<0.05 using one-way ANOVA with LSD post-hoc test. (C) The accumulative food intake for ZL and ZF rats over 56 days of pair-feeding regimen. (D) The food intake and (E) body mass change for ZL and ZF rats on day 56 of the pair-feeding regimen. * Indicates p<0.05 using one-way ANOVA with LSD post-hoc test.
Figure 4
Figure 4. The food intake, body mass and cumulative feed efficiency over 56 days of dietary manipulation.
(A) Two-day food intake of ZL and ZF on VAD ad libitum (VAD-AD, n = 5), VAS-Pair-feeding Last Day ad libitum (VAS-PF-AD, n = 5), VAS-Pair-feeding Last Day 4 meals (VAS-PF-4M, n = 5) (B) Body mass of ZL and ZF on VAD AD, VAS-PF AD and VAS-PF 4M. (C) Cumulative feed efficiency (unit weight gain per unit diet consumed) of ZL and ZF on VAD-AD, VAS-PF-AD and VAS-PF-4M. * Indicates p<0.05 using one-way ANOVA with LSD post-hoc test.
Figure 5
Figure 5. Insulin-induced Gck expression was attenuated in hepatocytes from VAS-PF-AD, but not VAS-PF-4M rats.
The primary hepatocytes were treated by insulin (0 nM to 100 nM) with or without RA (5 µM) in medium A for 6 hours. The expression level of Gck was determined by real-time PCR analysis, and the data were expressed as fold induction. The gene transcript levels from the no treatment group (0 nM insulin, no RA) for both ZL and ZF were arbitrarily set to 1. All p<0.05; for (A), a<b<c, a′<b′<c′, a″<b″<c″, d<e<f, d′<f′/g′, e′<g′, d″<e″<f″; for (B), h<i<j, h′<i′, h″<i″<j″, k<l<m, j′<k′<l′, k″<i″<m″, using one way ANOVA. *, #, and $ for comparing the effects of dietary manipulations at any treatment using one way ANOVA.
Figure 6
Figure 6. Transient overfeeding of the VAS diet impaired the insulin-suppressed Pck1 expression in hepatocytes of VAS-PF-AD ZL rats.
The primary hepatocytes were treated by insulin (0 nM to 100 nM) with or without RA (5 µM) in medium A for 6 hours. The expression level of Pck1 was determined by real-time PCR analysis, and the data were expressed as fold induction. The gene transcript levels from the no treatment group (0 nM insulin, no RA) for both ZL and ZF were arbitrarily set to 1. All p<0.05; for (A), a>b>c, a′>c′, a″>b″>c″, d>e>g, d>f, d′>f′/g′, e′>g′, d″>e″>f″>g″; for (B), h>i, h′>i′>j′, h″>i″>j″, k>l, k′>l′>m′, k″>l″, using one way ANOVA. *, #, and $ for comparing the effects of dietary manipulations at any treatment using one way ANOVA.
Figure 7
Figure 7. Transient overfeeding of VAS diet impaired insulin-induced Srebp-1c expression in hepatocytes of VAS-PF-AD rats.
The primary hepatocytes were treated by insulin (0 nM to 100 nM) with or without RA (5 µM) in medium A for 6 hours. The expression level of Srebp-1c was determined by real-time PCR analysis, and the data were expressed as fold induction. The gene transcript levels from the no treatment group (0 nM insulin, no RA) for both ZL and ZF were arbitrarily set to 1. All p<0.05; for (A), a<b<c<d, a′<b′, a″<b″<c″, e<f, c′<g′/f′, d′<f′, d″<e″<f″; for (B), g<h, g″<i″/j″, h″<j″, i<k/l, j<l, h′<l′, k″<l″, using one way ANOVA. *, #, and $ for comparing the effects of dietary manipulations at any treatment using one way ANOVA.
Figure 8
Figure 8. Differential expression levels of vitamin A metabolic genes in ZL and ZF primary hepatocytes.
The expression levels of Rbpr2 (A), Rdh2 (B), Raldh1 (C), Raldh4 (D), Cyp26a1 (E), and Rarb (F) were determined by real-time PCR in the cultured primary hepatocytes receiving no treatment. The data were expressed as −ΔCt (36B4 - gene of interest). All p<0.05; *, #, and $ for comparing the effects of dietary manipulation variables on gene transcript levels using two-way ANOVA with Bonferroni's post-hoc test; a>b, and c>d, using Student's t-test to compare ZL with ZF with the corresponding dietary manipulation.

References

    1. Chen G (2013) Roles of Vitamin A Metabolism in the Development of Hepatic Insulin Resistance. ISRN Hepatology 2013: 1–21 10.1016/j.cmet.2011.12.017 - DOI - PMC - PubMed
    1. Brown MS, Goldstein JL (2008) Selective versus total insulin resistance: a pathogenic paradox. Cell Metab 7: 95–96 10.1016/j.cmet.2007.12.009 - DOI - PubMed
    1. Angulo P (2002) Nonalcoholic fatty liver disease. N Engl J Med 346: 1221–1231 10.1056/NEJMra011775 - DOI - PubMed
    1. Johnson AMF, Olefsky JM (2013) The Origins and Drivers of Insulin Resistance. Cell 152: 673–684 10.1016/j.cell.2013.01.041 - DOI - PubMed
    1. O'Brien RM, Granner DK (1996) Regulation of gene expression by insulin. Physiol Rev 76: 1109–1161. - PubMed

Publication types