. 2014 Jul 11:12:46.
doi: 10.1186/s12964-014-0046-x.

The tumor marker Fascin is induced by the Epstein-Barr virus-encoded oncoprotein LMP1 via NF-κB in lymphocytes and contributes to their invasive migration

The tumor marker Fascin is induced by the Epstein-Barr virus-encoded oncoprotein LMP1 via NF-κB in lymphocytes and contributes to their invasive migration

Caroline F Mohr et al. Cell Commun Signal. .

Abstract

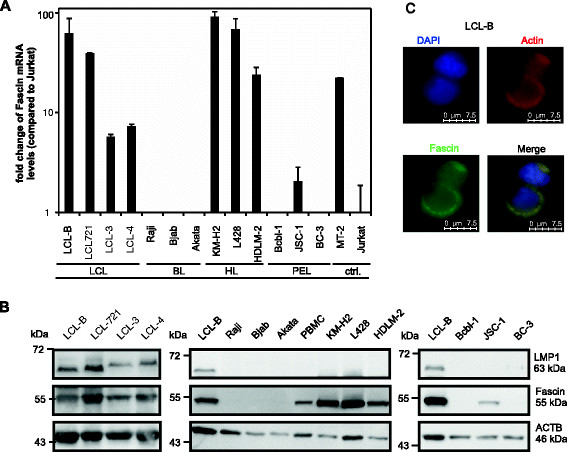
Background: The actin-bundling protein Fascin (FSCN1) is a tumor marker that is highly expressed in numerous types of cancer including lymphomas and is important for migration and metastasis of tumor cells. Fascin has also been detected in B lymphocytes that are freshly-infected with Epstein-Barr virus (EBV), however, both the inducers and the mechanisms of Fascin upregulation are still unclear.

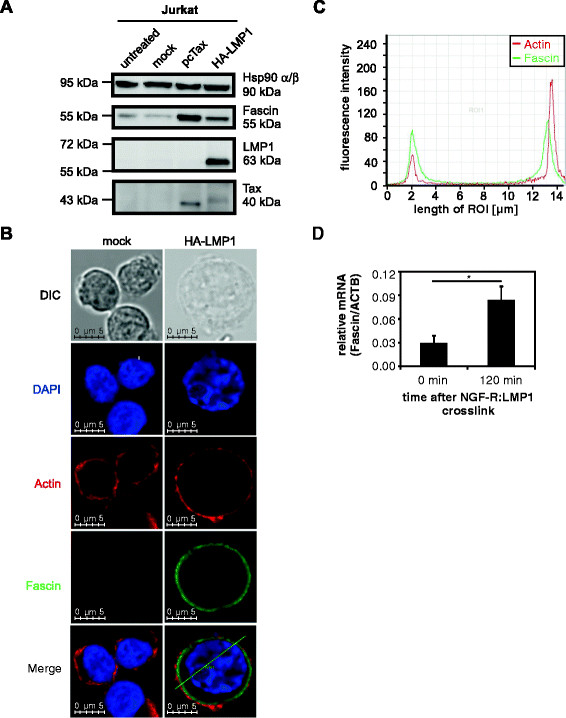
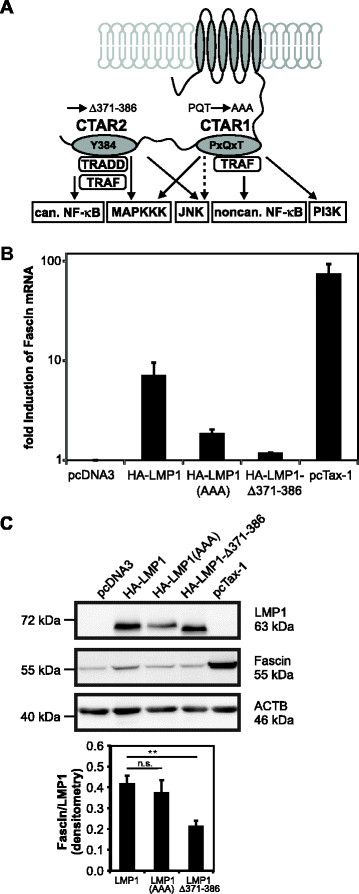
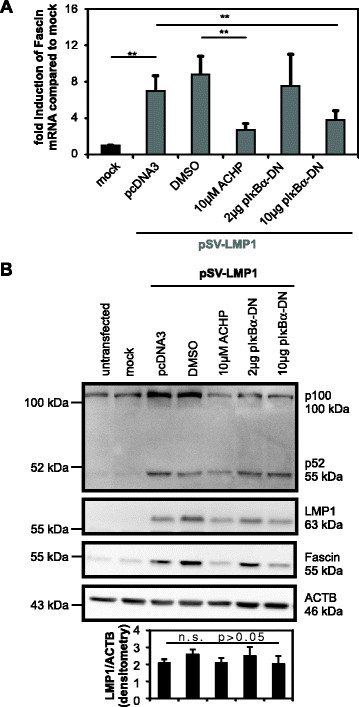
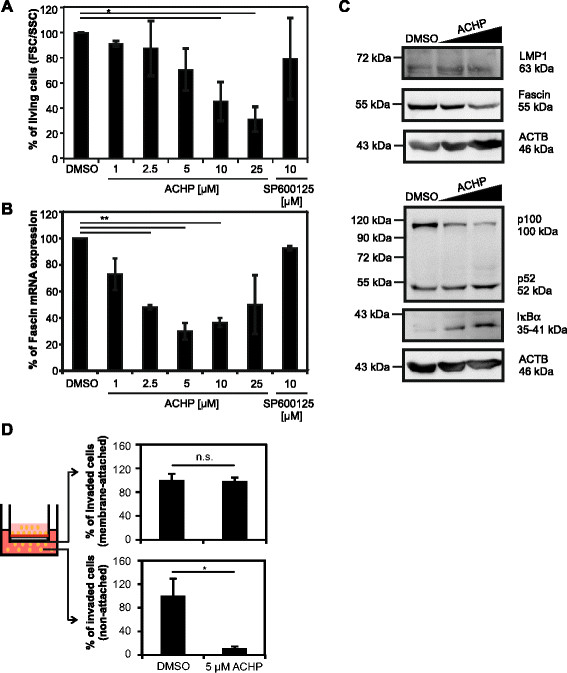
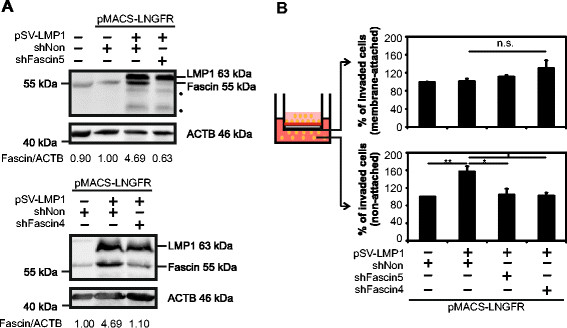
Results: Here we show that the EBV-encoded oncoprotein latent membrane protein 1 (LMP1), a potent regulator of cellular signaling and transformation, is sufficient to induce both Fascin mRNA and protein in lymphocytes. Fascin expression is mainly regulated by LMP1 via the C-terminal activation region 2 (CTAR2). Block of canonical NF-κB signaling using a chemical inhibitor of IκB kinase β (IKKβ) or cotransfection of a dominant-negative inhibitor of IκBα (NFKBIA) reduced not only expression of p100, a classical target of the canonical NF-κB-pathway, but also LMP1-induced Fascin expression. Furthermore, chemical inhibition of IKKβ reduced both Fascin mRNA and protein levels in EBV-transformed lymphoblastoid cell lines, indicating that canonical NF-κB signaling is required for LMP1-mediated regulation of Fascin both in transfected and transformed lymphocytes. Beyond that, chemical inhibition of IKKβ significantly reduced invasive migration of EBV-transformed lymphoblastoid cells through extracellular matrix. Transient transfection experiments revealed that Fascin contributed to LMP1-mediated enhancement of invasive migration through extracellular matrix. While LMP1 enhanced the number of invaded cells, functional knockdown of Fascin by two different small hairpin RNAs resulted in significant reduction of invaded, non-attached cells.

Conclusions: Thus, our data show that LMP1-mediated upregulation of Fascin depends on NF-κB and both NF-κB and Fascin contribute to invasive migration of LMP1-expressing lymphocytes.


Figures

Figure 1
Figure 1
Expression of Fascin in B-cell lymphomas. (A) Quantitative PCR (qPCR) of Fascin transcripts in transformed B-cells derived from EBV-transformed lymphoblastoid cell lines (LCL), from Burkitt lymphoma (BL), Hodgkin lymphoma (HL), and from primary effusion lymphoma (PEL) in comparison to Jurkat cells and Fascin-positive, HTLV-1-transformed MT-2 cells. Copy numbers were normalized to those of ß-Actin (ACTB) and thereafter normalized to relative Fascin expression in Jurkat cells. The means of two independent experiments are shown. ctrl. indicates control. (B) Detection of Fascin and LMP1 by immunoblot. In addition to the B-cell lines shown in (A), peripheral blood mononuclear cells (PBMC) from a healthy donor were analyzed. Detection of ACTB served as loading control. Slower migrating bands upon detection of LMP1 reflect HA-LMP1. (C) Immunofluorescence of EBV-transformed LCL-B cells spotted on fibronectin-coated coverslips using phalloidinX-TexasRed for detection of actin and anti-Fascin and secondary anti-mouse Alexa Fluor® 488 antibodies. Nuclei were stained with DAPI. Images were acquired using a LAS AF DMI 6000 fluorescence microscope equipped with a 63 × 1.4 HCX PL APO oil immersion objective lens. Jurkat cells (mock) as shown in Figure 2B served as negative control.
Figure 2
Figure 2
LMP1 induces Fascin in lymphocytes. (A) Detection of Fascin by immunoblot of Jurkat cells transiently transfected with wildtype (wt-) LMP1 expression plasmid (pCMV-HA-LMP1) in comparison to mock-transfected (pcDNA3) and Tax-transfected Jurkat cells. As loading control served detection of Hsp90 α/β. (B) Triple immunofluorescence staining and confocal microscopy of Jurkat cells transiently transfected with wt-LMP1 expression plasmid (pCMV-HA-LMP1) in comparison to mock-transfected Jurkat cells. Cells were spotted on fibronectin-coated coverslips using phalloidinX-TexasRed for detection of actin and anti-Fascin and secondary anti-mouse Alexa Flour® 488 antibodies. Nuclei were stained with DAPI. Images were acquired using a Leica TCS SP5 confocal laser scanning microscope equipped with a 63 × 1.4 HCX PL APO CS oil immersion objective lens (Leica). DIC indicates differential interference contrast, ROI, region of interest. (C) Profiles of the fluorescence intensities of Fascin and actin plotted against the length of the ROI in Jurkat cells expressing LMP1 as shown in (B). (D) qPCR of Fascin in NGF-R:LMP1 LCLs (B2264-19/3) at the indicated times after cross-linking with anti-NGF-R and anti-fc IgG/IgM antibodies. Copy numbers were normalized to those of ACTB. The means of five independent experiments +/−SE were compared (t-test). *indicates P < 0.05.
Figure 3
Figure 3
CTAR2 is the major site of LMP1-mediated Fascin induction. (A) Scheme of LMP1 and its signaling domains, the C-terminal activating regions 1 (CTAR1; aa 194–231) and 2 (CTAR2; aa 351–386). Mutations of the P(204)xQxT consensus motif to AxAxA in CTAR1 and deletion of aa 371–386 in CTAR2 are indicated. Signaling pathways induced by LMP1 are shown in rectangular boxes, adaptor molecules in rounded boxes. can. indicates canonical; noncan., noncanonical. (B) qPCR of Fascin transcripts 48 h after transfection of Jurkat cells with wt-LMP1 (20 μg pCMV-HA-LMP1), LMP1 mutants (40 μg pCMV-HA-LMP1(AAA), 20 μg of pCMV-HA-LMP1-Δ371-386) and HTLV-1/Tax (40 μg pcTax-1) in comparison to mock-transfected cells (100 μg pcDNA3). Total transfected DNA was adjusted to 100 μg with pcDNA3. Copy numbers were normalized to those of ACTB and on mock-transfected cells. Mean values +/− standard error (SE) are given. (C) Detection of Fascin and LMP1 by immunoblot after transient transfection of Jurkat cells with the constructs described in (B). Fascin expression was quantitatively evaluated by densitometry and normalized on LMP1 protein expression. The mean of three independent experiments +/−SE is shown. **indicates P < 0.01. n.s., not significant.
Figure 4
Figure 4
NF-κB signals are required for LMP1-mediated Fascin induction. (A) Quantitative PCR of Fascin mRNA in Jurkat cells after transfection of wt-LMP1 (pSV40-LMP1) and co-transfection of pIκBα-DN or treatment with the IKKβ inhibitor ACHP (2-Amino-6-(2-(cyclopropylmethoxy)-6-hydroxyphenyl)-4-(4-piperidinyl)-3-pyridine-carboni-trile) solved in DMSO. ACHP (10 μM) was added 24 h after transfection for 24 h. Relative copy numbers were determined by normalizing Fascin transcripts to those of ACTB. Mean values +/− SE were compared using a t-test (n = 4). **indicates P < 0.01. (B) Immunoblot of Fascin, LMP1, p100, p52, and ACTB (ß-Actin) in Jurkat cells after transfections as described in (A). LMP1 expression was quantitatively evaluated by densitometry and normalized on ACTB protein expression. The mean of four independent experiments +/−SE is shown and was compared (t-test, n = 4, P > 0.05). n.s. indicates not significant.
Figure 5
Figure 5
NF-κB signals are required for maintaining Fascin expression and invasive migration of EBV-transformed LMP1-expressing lymphoblastoid cells (LCL). (A) Viability of LCL-B cells upon treatment with increasing amounts of the IKKβ inhibitor ACHP (1, 2.5, 5, 10, 25 μM) and the JNK-inhibitor SP600125 (10 μM) for 48 h determined by forward-side scatter (FSC/SSC) analysis in flow cytometry. DMSO-treated cells were set as 100%. The means of three independent experiments +/− SE were compared using a paired t-test. *indicates P < 0.05. (B) Quantitative PCR of Fascin transcripts normalized to ACTB in LCL-B upon ACHP-and SP600125-treatment for 48 h. The means of three independent experiments +/− SE were normalized to solvent-treated cells and compared using a paired t-test. **indicates P < 0.01. (C) Detection of Fascin, LMP1, p100 processing (p100/p52) and IκBα by immunoblot after treatment of LCL-B with DMSO, 2.5 and 5 μM ACHP for 48 h. ACTB served as loading control. Samples were loaded on two gels in parallel. (D) LCL-B cells were cultured in presence of ACHP (5 μM) or solvent (DMSO) for 48 h and cells were serum-starved (1% fetal calf serum (FCS)) for 4 h. Invasion assays were performed using trans-wells coated with extracellular matrix for 24 h. Values shown in the upper panel reflect the percentage of invaded cells (measured at OD 560 nm) that are attached to the bottom of the membrane. The lower bar graphs show the percentage of invaded cells that are non-attached and have migrated to the medium (20% FCS) of the lower compartment. Solvent-treated cells (DMSO) were set as 100%. Mean values and error bars of three independent experiments each performed in triplicates are shown. Values were compared using a paired t-test. *indicates P < 0.05. n.s., not significant.
Figure 6
Figure 6
Knockdown of Fascin in LMP1-transfected Jurkat cells diminishes invasion through extracellular matrix. (A) Jurkat cells were transfected with pMACS-LNGFR, wt-LMP1 (pSV-LMP1) and shFascin5, shFascin4 or shNonsense (shNon) and subjected to magnetic separation. Immunoblots of Fascin, LMP1 and ACTB are shown. Numbers indicate the relative expression of Fascin normalized on ACTB as determined by densitometry (at least 4 experiments). Values obtained from cells transfected with LMP1 and a control shRNA (shNon) were set as 1. indicates cross reactions of the LMP1-antibody. (B) Invasion assays were performed with serum-starved Jurkat cells (1% FCS) after magnetic separation using trans-wells coated with extracellular matrix for 24 h. Values shown in the upper panel reflect the percentage of invaded cells (measured at OD 560 nm) that are attached to the bottom of the membrane. The lower bar graphs show the percentage of invaded cells that are non-attached and have migrated to the medium (20% FCS) of the lower compartment. Mock-transfected cells were set as 100%. Mean values and error bars of three independent experiments each performed in quadruplicates are shown. Values were compared using a paired t-test. **indicates P < 0.01. *indicates P < 0.05. n.s., not significant.

References

    1. Young LS, Rickinson AB. Epstein-Barr virus: 40 years on. Nat Rev Cancer. 2004;4:757–768. doi: 10.1038/nrc1452. - DOI - PubMed
    1. Kuppers R. B cells under influence: transformation of B cells by Epstein-Barr virus. Nat Rev Immunol. 2003;3:801–812. doi: 10.1038/nri1201. - DOI - PubMed
    1. Wang D, Liebowitz D, Kieff E. An EBV membrane protein expressed in immortalized lymphocytes transforms established rodent cells. Cell. 1985;43:831–840. doi: 10.1016/0092-8674(85)90256-9. - DOI - PubMed
    1. Baichwal VR, Sugden B. Transformation of Balb 3T3 cells by the BNLF-1 gene of Epstein-Barr virus. Oncogene. 1988;2:461–467. - PubMed
    1. Kilger E, Kieser A, Baumann M, Hammerschmidt W. Epstein-Barr virus-mediated B-cell proliferation is dependent upon latent membrane protein 1, which simulates an activated CD40 receptor. EMBO J. 1998;17:1700–1709. doi: 10.1093/emboj/17.6.1700. - DOI - PMC - PubMed

Publication types

MeSH terms