

On the likelihood ratio tests in bivariate ACDE models
- PMID: 25106394
- PMCID: PMC4129549
- DOI: 10.1007/s11336-012-9304-2
On the likelihood ratio tests in bivariate ACDE models
Abstract
The ACE and ADE models have been heavily exploited in twin studies to identify the genetic and environmental components in phenotypes. However, the validity of the likelihood ratio test (LRT) of the existence of a variance component, a key step in the use of such models, has been doubted because the true values of the parameters lie on the boundary of the parameter space of the alternative model for such tests, violating a regularity condition required for a LRT (e.g., Carey in Behav. Genet. 35:653-665, 2005; Visscher in Twin Res. Hum. Genet. 9:490-495, 2006). Dominicus, Skrondal, Gjessing, Pedersen, and Palmgren (Behav. Genet. 36:331-340, 2006) solve the problem of testing univariate components in ACDE models. Our current work as presented in this paper resolves the issue of LRTs in bivariate ACDE models by exploiting the theoretical frameworks of inequality constrained LRTs based on cone approximations. Our derivation shows that the asymptotic sampling distribution of the test statistic for testing a single bivariate component in an ACE or ADE model is a mixture of χ (2) distributions of degrees of freedom (dfs) ranging from 0 to 3, and that for testing both the A and C (or D) components is one of dfs ranging from 0 to 6. These correct distributions are stochastically smaller than the χ (2) distributions in traditional LRTs and therefore LRTs based on these distributions are more powerful than those used naively. Formulas for calculating the weights are derived and the sampling distributions are confirmed by simulation studies. Several invariance properties for normal data (at most) missing by person are also proved. Potential generalizations of this work are also discussed.
Figures
 and its polar cone
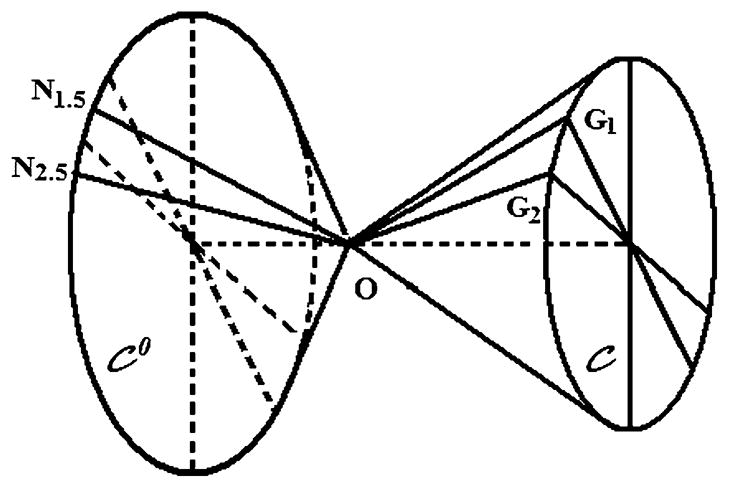
 . Suppose the cone
is approximated by a polyhedral cone with edges g1 =OG1, g2 =OG2, etc. If the discretization is fine, the normal vector of the face OG1G2 can be approximated by ON1.5, which is a generatrix on the surface of
with longitude between those of g1 and g2. The projections of points inside the pyramid O – N1.5G1G2 to the polyhedral cone lie on the face OG1G2; the projections of points inside the pyramid O – G2N1.5N2.5 to the polyhedral cone lie on the edge OG2.
. Suppose the cone
is approximated by a polyhedral cone with edges g1 =OG1, g2 =OG2, etc. If the discretization is fine, the normal vector of the face OG1G2 can be approximated by ON1.5, which is a generatrix on the surface of
with longitude between those of g1 and g2. The projections of points inside the pyramid O – N1.5G1G2 to the polyhedral cone lie on the face OG1G2; the projections of points inside the pyramid O – G2N1.5N2.5 to the polyhedral cone lie on the edge OG2.
References
-
- Carey G. Cholesky problems. Behavior Genetics. 2005;35:653–665. - PubMed
-
- Chernoff H. On the distribution of the likelihood ratio. The Annals of Mathematical Statistics. 1954;25:573–578.
-
- Dominicus A, Skrondal A, Gjessing HK, Pedersen NL, Palmgren J. Likelihood ratio tests in behavioral genetics: problems and solutions. Behavior Genetics. 2006;36:331–340. - PubMed
-
- Gupta AK, Nagar DK. Matrix variate distributions. London: Chapman & Hall/CRC; 1999.
Publication types
MeSH terms
Grants and funding
LinkOut - more resources
Full Text Sources
Miscellaneous
