. 2014 Sep 19;289(38):26584-26596.
doi: 10.1074/jbc.M114.555987. Epub 2014 Aug 8.

Overexpression of Galnt3 in chondrocytes resulted in dwarfism due to the increase of mucin-type O-glycans and reduction of glycosaminoglycans

Affiliations

Overexpression of Galnt3 in chondrocytes resulted in dwarfism due to the increase of mucin-type O-glycans and reduction of glycosaminoglycans

Carolina Andrea Yoshida et al. J Biol Chem. .

Abstract

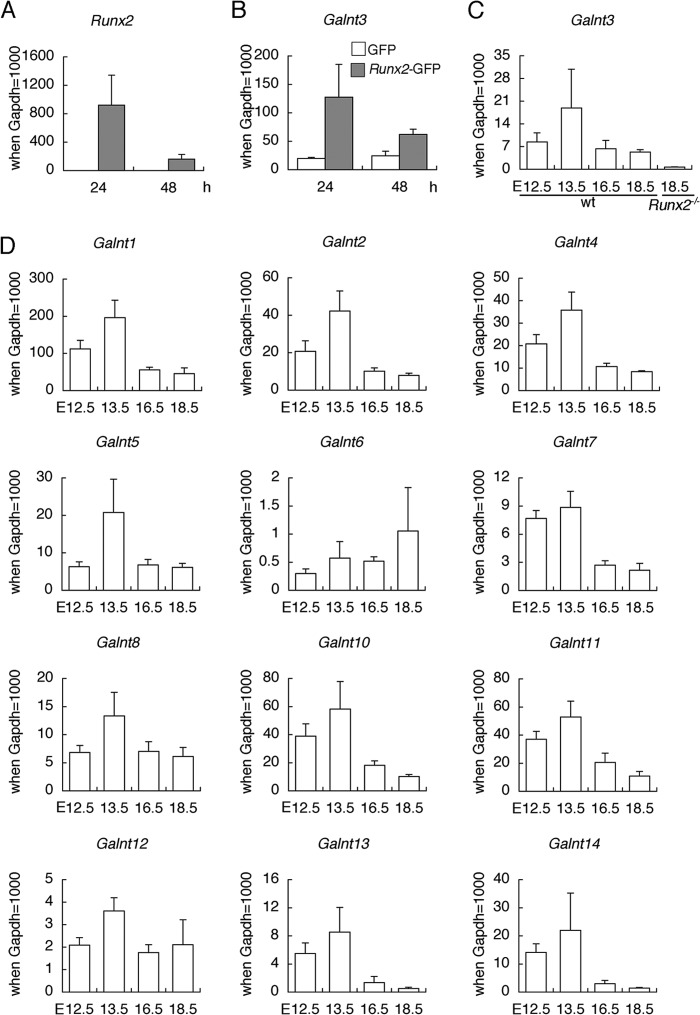
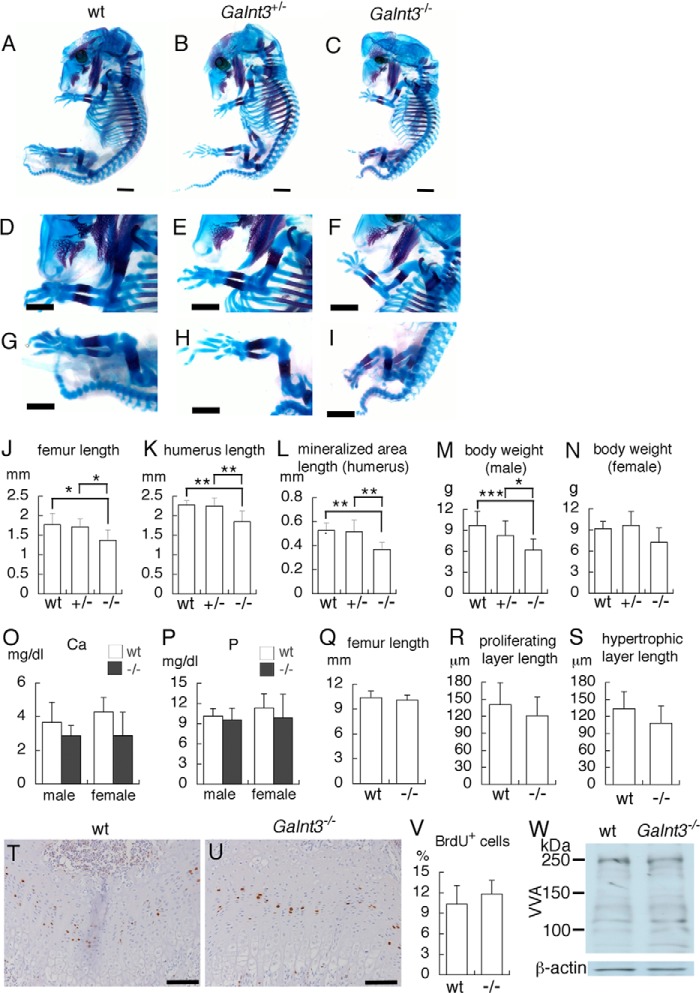
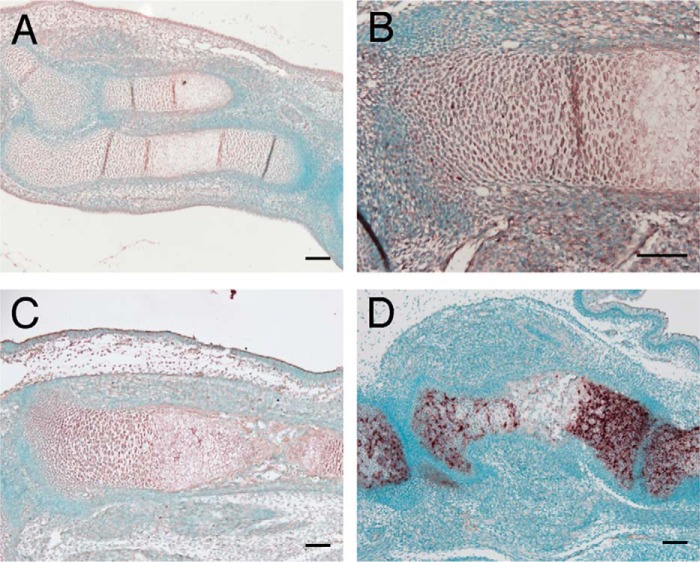
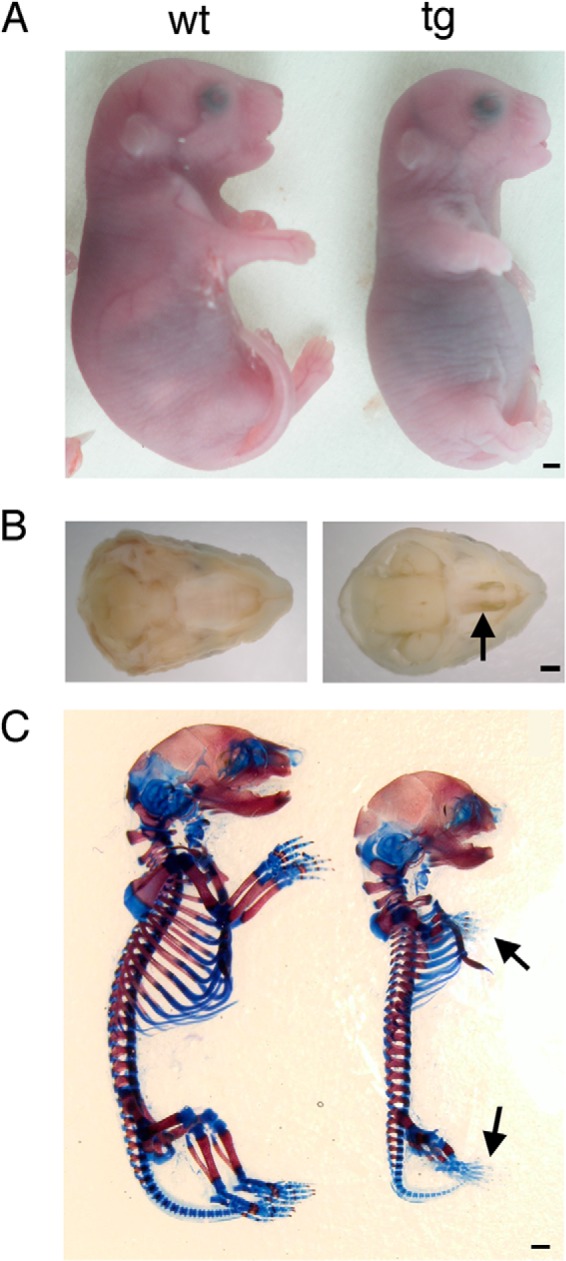
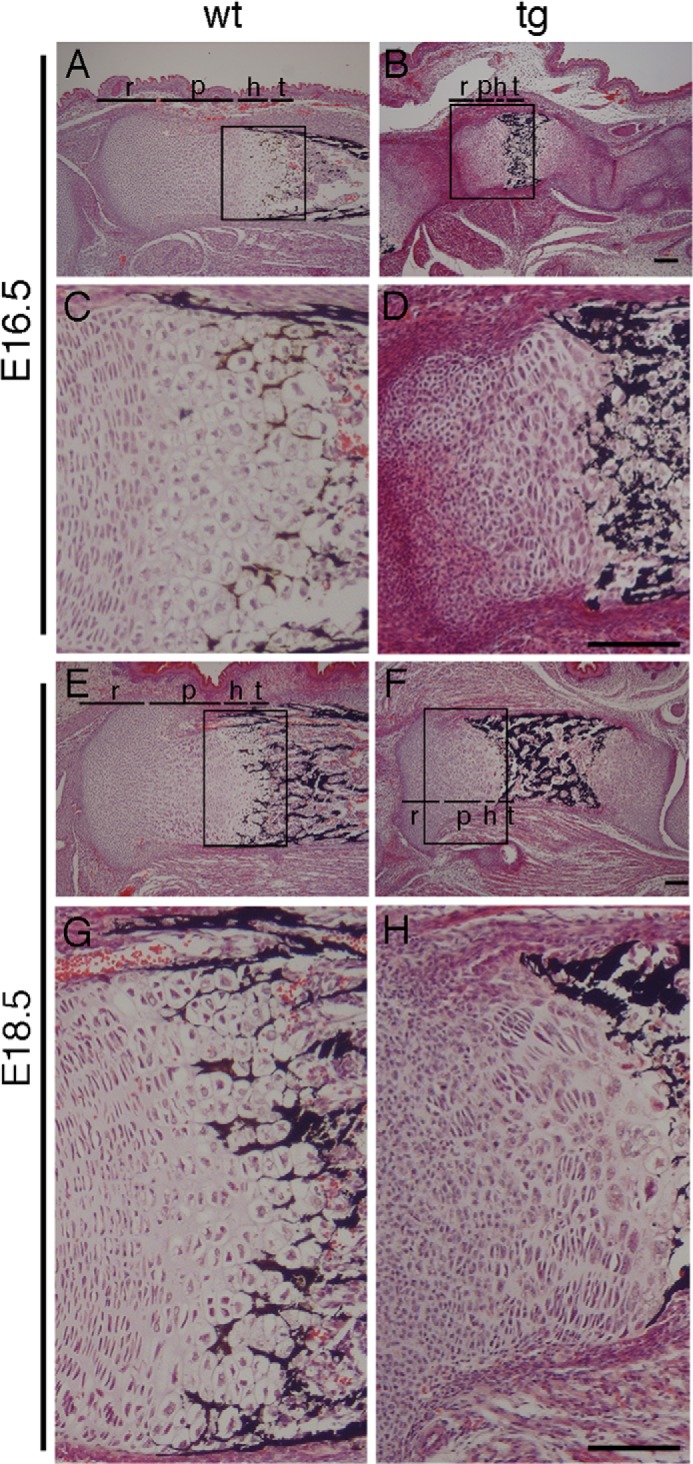
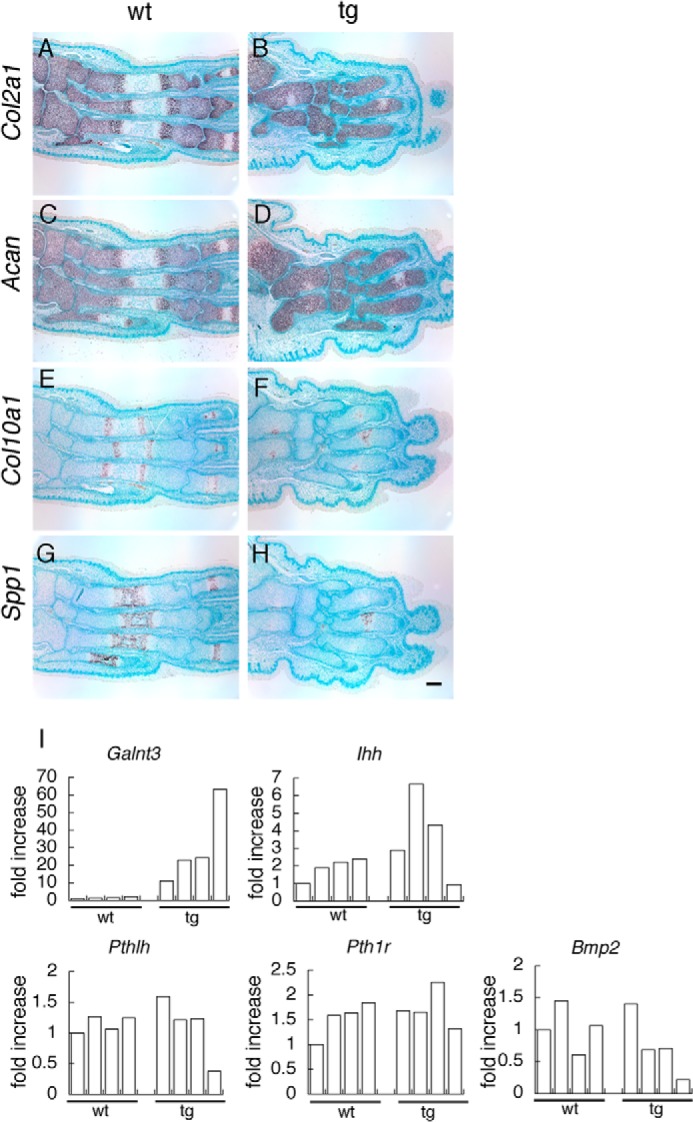
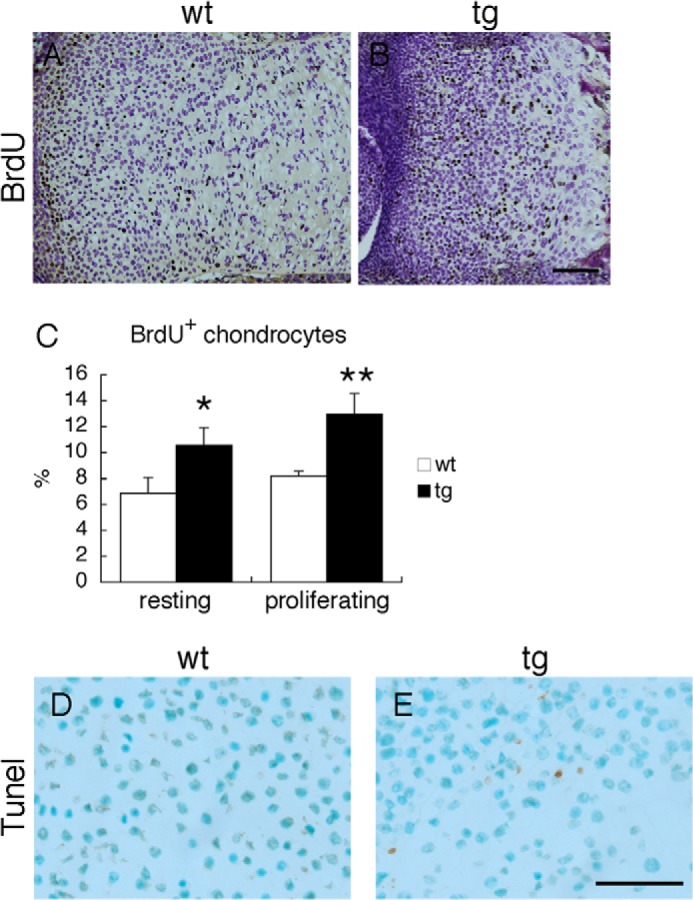
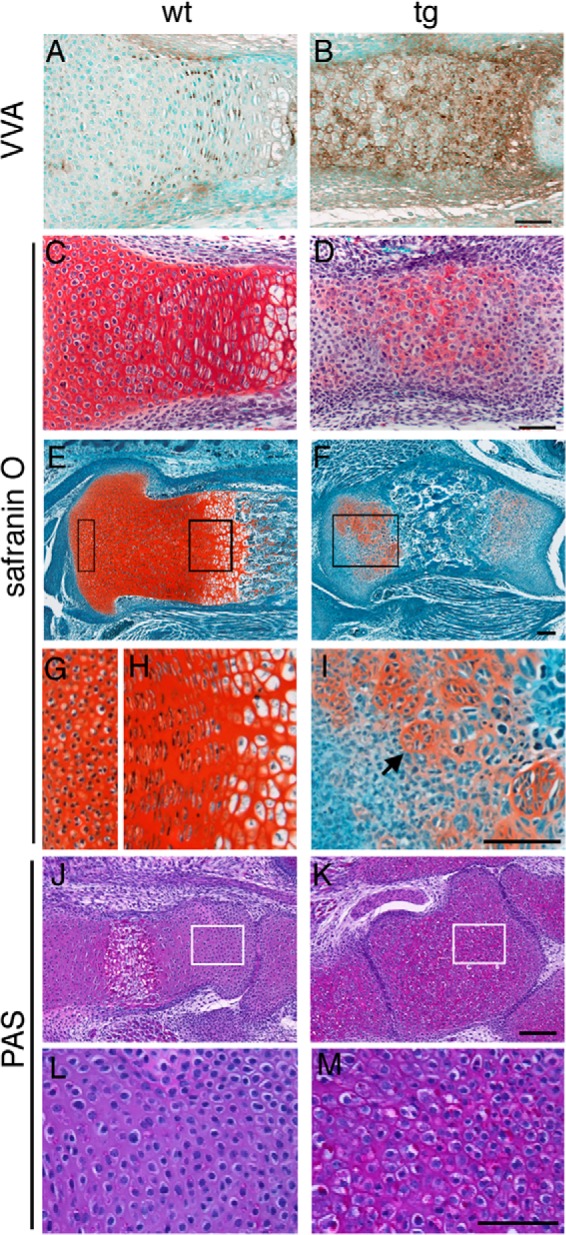
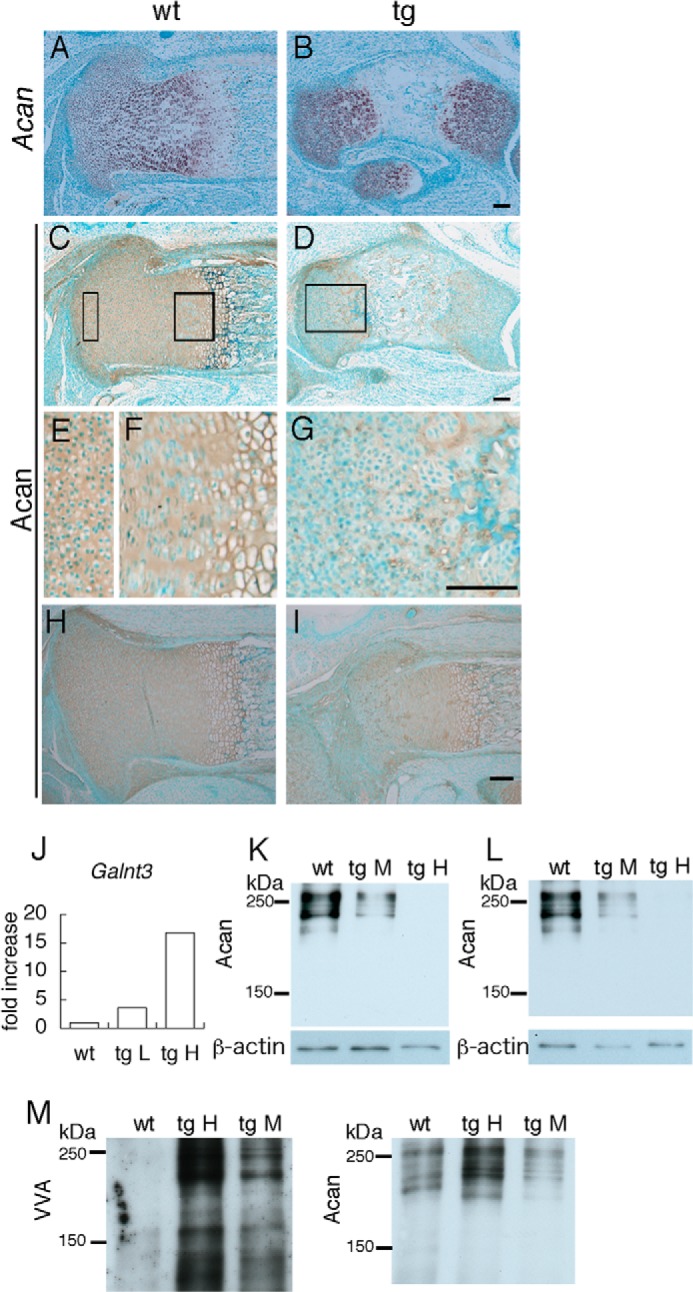
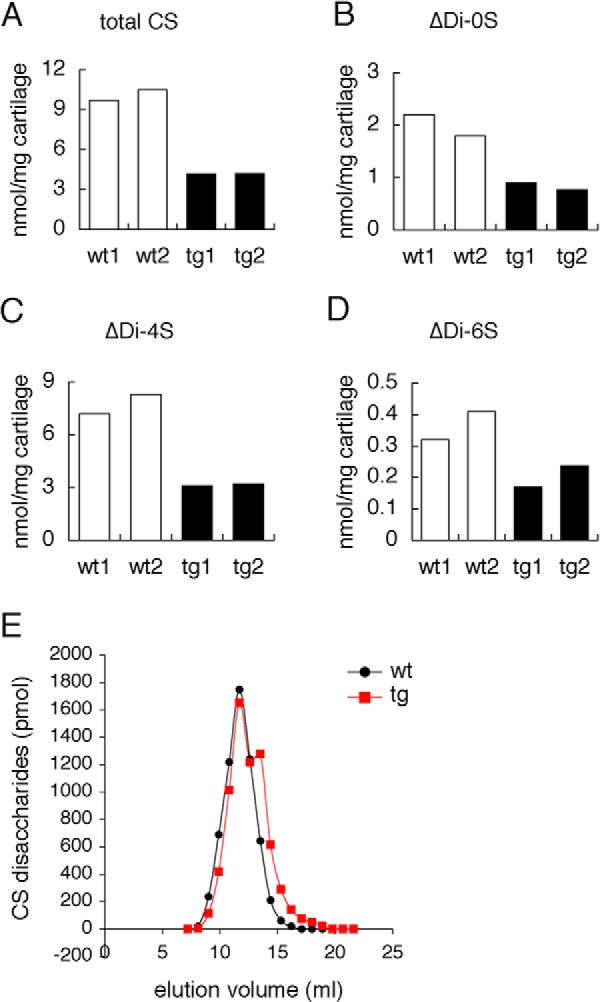
Galnt3, UDP-N-acetyl-α-D-galactosamine:polypeptide N-acetylgalactosaminyltransferase 3, transfers N-acetyl-D-galactosamine to serine and threonine residues, initiating mucin type O-glycosylation of proteins. We searched the target genes of Runx2, which is an essential transcription factor for chondrocyte maturation, in chondrocytes and found that Galnt3 expression was up-regulated by Runx2 and severely reduced in Runx2(-/-) cartilaginous skeletons. To investigate the function of Galnt3 in chondrocytes, we generated Galnt3(-/-) mice and chondrocyte-specific Galnt3 transgenic mice under the control of the Col2a1 promoter-enhancer. Galnt3(-/-) mice showed a delay in endochondral ossification and shortened limbs at embryonic day 16.5, suggesting that Galnt3 is involved in chondrocyte maturation. Galnt3 transgenic mice presented dwarfism, the chondrocyte maturation was retarded, the cell cycle in chondrocytes was accelerated, premature chondrocyte apoptosis occurred, and the growth plates were disorganized. The binding of Vicia villosa agglutinin, which recognizes the Tn antigen (GalNAc-O-Ser/Thr), was drastically increased in chondrocytes, and aggrecan (Acan) was highly enriched with Tn antigen. However, safranin O staining, which recognizes glycosaminoglycans (GAGs), and Acan were severely reduced. Chondroitin sulfate was reduced in amount, but the elongation of chondroitin sulfate chains had not been severely disturbed in the isolated GAGs. These findings indicate that overexpression of Galnt3 in chondrocytes caused dwarfism due to the increase of mucin-type O-glycans and the reduction of GAGs, probably through competition with xylosyltransferases, which initiate GAG chains by attaching O-linked xylose to serine residues, suggesting a negative effect of Galnt family proteins on Acan deposition in addition to the positive effect of Galnt3 on chondrocyte maturation.

Keywords: Aggrecan; Chondrocyte; Galnt3; Glycosaminoglycan; Glycosyltransferase; Mucin; Mucin-type O-Glycan; Proteoglycan.


Figures

FIGURE 1.
FIGURE 1.
Real-time RT-PCR analysis. A and B, induction of Galnt3 expression by Runx2. Runx2−/− primary chondrocytes were infected with adenovirus expressing GFP (open columns) or expressing Runx2 and GFP (closed columns), and the expressions of Runx2 (A) and Galnt3 (B) were examined at 24 and 48 h after the infection. n = 3. C and D, Galnt3 expression in wild-type mice at E12.5, E13.5, E16.5, and E18.5 and Runx2−/− mice at E18.5 (C) and the expression of Galnt family genes in wild-type mice at E12.5, E13.5, E16.5, and E18.5 (D). n = 3–6. Gapdh was used as an internal control, and the value of Gapdh was set as 1000 and the relative levels are shown. Error bars, S.D.
FIGURE 2.
FIGURE 2.
Phenotypes of Galnt3−/− mice. A–L, skeletal examination at E16.5. Lateral views of whole embryos (A–C), forelimbs (D–F), and hind limbs (G–I) of wild-type (A, D, and G), Galnt3+/− (B, E, and H), and Galnt3−/− (C, F, and I) embryos. The lengths of femurs (J), humeri (K), and the mineralized area of humeri (L) in wild-type (n = 8), Galnt3+/− (n = 11), and Galnt3−/− (n = 6) embryos were measured. M–V, analyses of mice at 3 weeks of age. M, body weight of wild-type (n = 18), Galnt3+/− (n = 26), and Galnt3−/− (n = 11) male mice. N, body weight of wild-type (n = 10), Galnt3+/− (n = 24), and Galnt3−/− (n = 9) female mice. O and P, serum concentration of calcium (O) and phosphate (P) in wild-type (male, n = 11; female, n = 5) and Galnt3−/− (male, n = 3; female, n = 5) mice. Q–S, the lengths of femurs (Q) and lengths of proliferating (R) and hypertrophic (S) layers in wild-type (n = 10) and Galnt3−/− (n = 10) male mice. The lengths of proliferating and hypertrophic chondrocyte layers were measured using H&E-stained sections. T–V, BrdU staining of wild-type (T) and Galnt3−/− (U) male mice and the frequencies of BrdU-positive cells in the growth plates of femurs in wild-type (n = 5) and Galnt3−/− (n = 5) male mice (V). W, reactivity to VVA. Lysates, which were prepared from the epiphyses of femurs and tibiae at postnatal day 10, were treated with chondroitinase ABC. The membrane was reacted with VVA or exposed to anti-β-actin antibody. Similar results were obtained in four wild-type and four Galnt3−/− mice, and representative data are shown. *, p < 0.05; **, p < 0.01; ***, p < 0.001. Scale bars, 1 mm (A–I) and 100 μm (T and U). Error bars, S.D.
FIGURE 3.
FIGURE 3.
In situ hybridization of Galnt3 mRNA. Shown is in situ hybridization of Galnt3 mRNA using sections of wild-type forelimb at E13.5 (A) and tibia at E14.5 (B) and E15.5 (C) and Galnt3 transgenic tibia at E16.5 (D). Scale bars, 100 μm.
FIGURE 4.
FIGURE 4.
Appearance and skeletal system of Galnt3 transgenic embryos. A, macroscopic appearance of wild-type (wt) and Galnt3 transgenic (tg) embryos at E18.5. The abdomen in Galnt3 transgenic embryos was protruded because of the small thoracic cage. B, macroscopic views of the palates of wild-type (left) and Galnt3 transgenic (right) embryos at E18.5. A Galnt3 transgenic embryo presents cleft palate (arrow). C, skeletons of wild-type (left) and Galnt3 transgenic (right) embryos at E18.5 stained with alizarin red and Alcian blue. The arrows indicate the reduced Alcian blue staining and the lack of alizarin red staining in the bones of the hand and foot. Scale bars, 1 mm.
FIGURE 5.
FIGURE 5.
Histological analysis of growth plates. H&E and von Kossa staining of tibia sections at E16.5 (A–D) and E18.5 (E–H) from wild-type (A, C, E, and G) and Galnt3 transgenic mice (B, D, F, and H). Boxed regions in A, B, E, and F are magnified in C, D, G, and H, respectively. The layers of resting (r), proliferating (p), hypertrophic (h), and terminal hypertrophic (t) chondrocytes are shown in A, B, E, and F. Scale bars, 100 μm.
FIGURE 6.
FIGURE 6.
In situ hybridization and real-time RT-PCR analysis. Shown is in situ hybridization of sections of tarsal and metatarsal bones from wild-type (A, C, E, and G) and Galnt3 transgenic (B, D, F, and H) embryos at E18.5 using Col2a1 (A and B), Acan (C and D), Col10a1 (E and F), and Spp1 (G and H) antisense probes. We detected no signal using sense probes (data not shown). Scale bar, 100 μm. I, real-time RT-PCR analysis of Galnt3, Ihh, Pthlh, Pth1r, and Bmp2. RNA was extracted from the cartilaginous tissues of four wild-type and four F0 Galnt3 transgenic embryos at E15.5.
FIGURE 7.
FIGURE 7.
BrdU labeling and TUNEL staining. A and B, immunolocalization of incorporated BrdU on tibia slices from wild-type (A) and Galnt3 transgenic (B) embryos at E18.5. Scale bar, 100 μm. C, the percentage of BrdU-positive cells in wild-type (wt) and Galnt3 transgenic (tg) mice. The percentage was analyzed in the resting and proliferating layers. The cells in a minimum of three sections per embryo were counted, and three wild-type and three Galnt3 transgenic embryos were examined. *, p < 0.05; **, p < 0.001. D and E, TUNEL staining of resting chondrocyte layers from wild-type (D) and Galnt3 transgenic (E) embryos at E18.5. Scale bar, 50 μm. Error bars, S.D.
FIGURE 8.
FIGURE 8.
Lectin histochemistry and safranin O and PAS staining. A and B, VVA histochemistry. VVA-binding was examined using sections of metatarsal bones from wild-type (A) and Galnt3 transgenic (B) embryos at E18.5. C and D, the serial sections of A and B were stained with safranin O. E–I, safranin O staining of sections of tibiae from wild-type (E, G, and H) and Galnt3 transgenic (F and I) embryos at E18.5. The two boxed regions in E are magnified in G and H, and the boxed region in F is magnified in I. The arrow in I indicates a group of chondrocytes disposed in a round-shaped cluster instead of a columnar form. J–M, PAS staining of sections of calcanei from wild-type (J and L) and Galnt3 transgenic (K and M) embryos at E18.5. The boxed regions in J and K are magnified in L and M, respectively. Scale bars, 50 μm (A–D, L, and M) and 100 μm (E–K).
FIGURE 9.
FIGURE 9.
In situ hybridization, immunohistochemistry, Western blot, and immunoprecipitation. A and B, in situ hybridization of Acan mRNA in tibiae from wild-type (A) and Galnt3 transgenic (B) embryos at E18.5. C–I, Acan core protein immunostaining on tibia sections from wild-type (C, E, F, and H) and Galnt3 transgenic (D, G, and I) embryos at E18.5. The two boxed regions in C are magnified in E and F, and the boxed region in D is magnified in G. Scale bars, 100 μm. J, real-time RT-PCR analysis. Galnt3 expression in a wild-type mouse at E18.5, a Galnt3 transgenic mouse with low transgene expression shown in I (tg L), and a Galnt3 transgenic mouse with high transgene expression shown in B, D, and G (tg H) is shown. The value in the wild-type mouse was set as 1, and relative levels are shown. K and L, Western blots of proteins extracted from the cartilaginous skeletons of wild-type, Galnt3 transgenic embryo with medial transgene expression (tg M) and Galnt3 transgenic embryo with high transgene expression (tg H) at E15.5. Lysates were digested with chondroitinase ABC (K) or with chondroitinase ABC, neuraminidase, and O-glycosidase (L). Membranes were exposed to anti-Acan (top) and anti-actin (bottom) antibodies. M, VVA reactivity of Acan. Lysate treated with chondroitinase ABC was immunoprecipitated by anti-Acan antibody. The membrane was reacted with VVA or exposed to anti-Acan antibody.
FIGURE 10.
FIGURE 10.
Quantification of chondroitin sulfate disaccharides in isolated GAGs from cartilaginous skeletons. A–D, chondroitin sulfate disaccharide content in isolated GAGs from cartilaginous skeletons of wild-type (wt1 and wt2) and Galnt3 transgenic (tg1 and tg2) embryos at E15.5. CS, chondroitin sulfate; ΔDi-0S, non-sulfated chondroitin; ΔDi-4S, chondroitin 4-sulfate; ΔDi-6S, chondroitin 6-sulfate. E, chondroitin sulfate chain length analysis. Chondroitin sulfate disaccharide content in the fractionated GAGs isolated from cartilaginous skeletons of wild-type (wt) and Galnt3 transgenic (tg) embryos at E15.5 was quantitated.

Similar articles

Cited by

References

    1. Lefebvre V., Bhattaram P. (2010) Vertebrate skeletogenesis. Curr. Top. Dev. Biol. 90, 291–317 - PMC - PubMed
    1. Zhao Q., Eberspaecher H., Lefebvre V., De Crombrugghe B. (1997) Parallel expression of Sox9 and Col2a1 in cells undergoing chondrogenesis. Dev. Dyn. 209, 377–386 - PubMed
    1. Gentili C., Cancedda R. (2009) Cartilage and bone extracellular matrix. Curr. Pharm. Des. 15, 1334–1348 - PubMed
    1. Varki A., Cummings R. D., Esko J. D., Freeze H. H., Stanley P., Bertozzi C. R., Hart G. W., Etzler M. E. (eds) (2009) Essentials of Glycobiology, pp. 229–248, Cold Spring Harbor Laboratory Press, Cold Spring Harbor, NY - PubMed
    1. Heinegård D. (2009) Proteoglycans and more from molecules to biology. Int. J. Exp. Pathol. 90, 575–586 - PMC - PubMed

Publication types

MeSH terms