. 2015 Feb;14(2):116-27.
doi: 10.1128/EC.00164-14. Epub 2014 Aug 8.

Membrane dynamics at the nuclear exchange junction during early mating (one to four hours) in the ciliate Tetrahymena thermophila

Affiliations

Membrane dynamics at the nuclear exchange junction during early mating (one to four hours) in the ciliate Tetrahymena thermophila

Eric S Cole et al. Eukaryot Cell. 2015 Feb.

Abstract

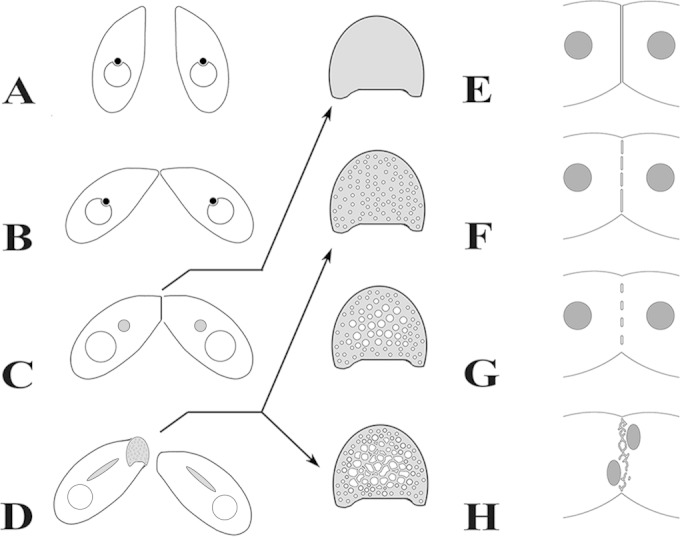
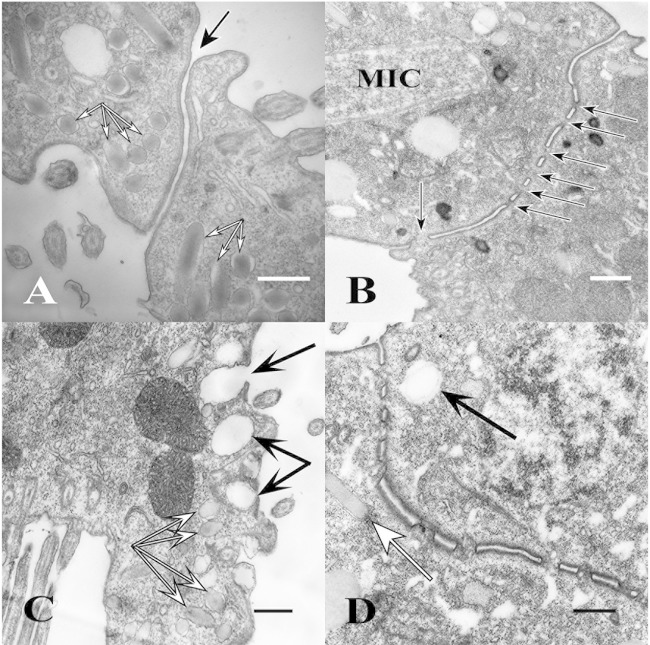
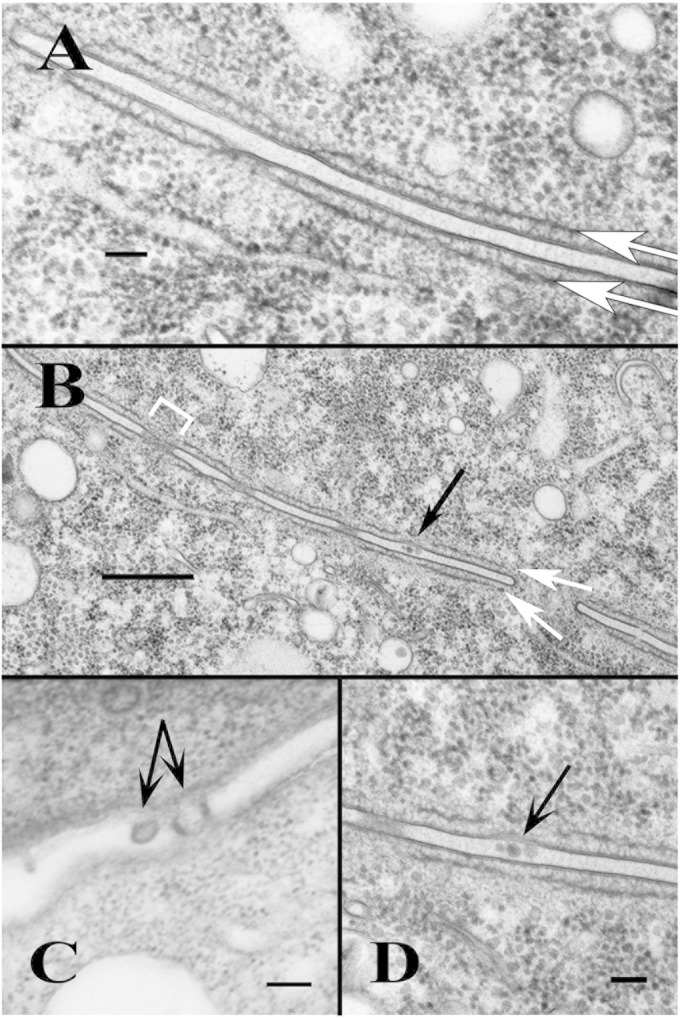
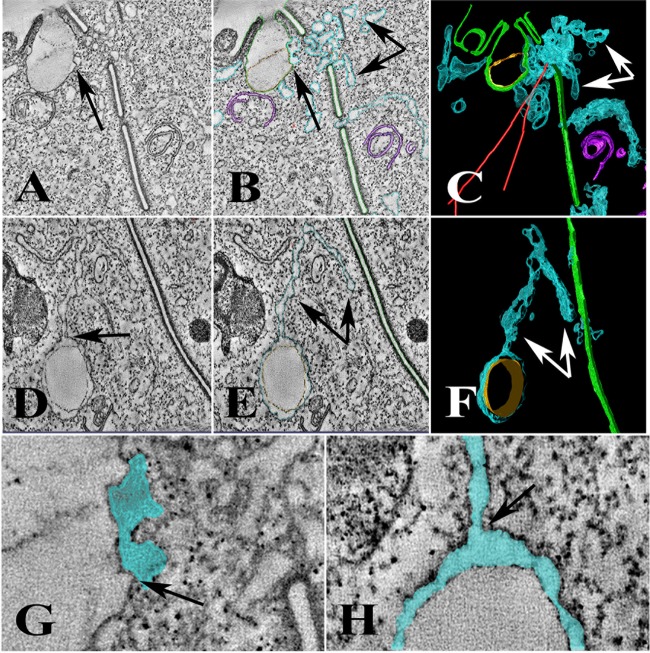
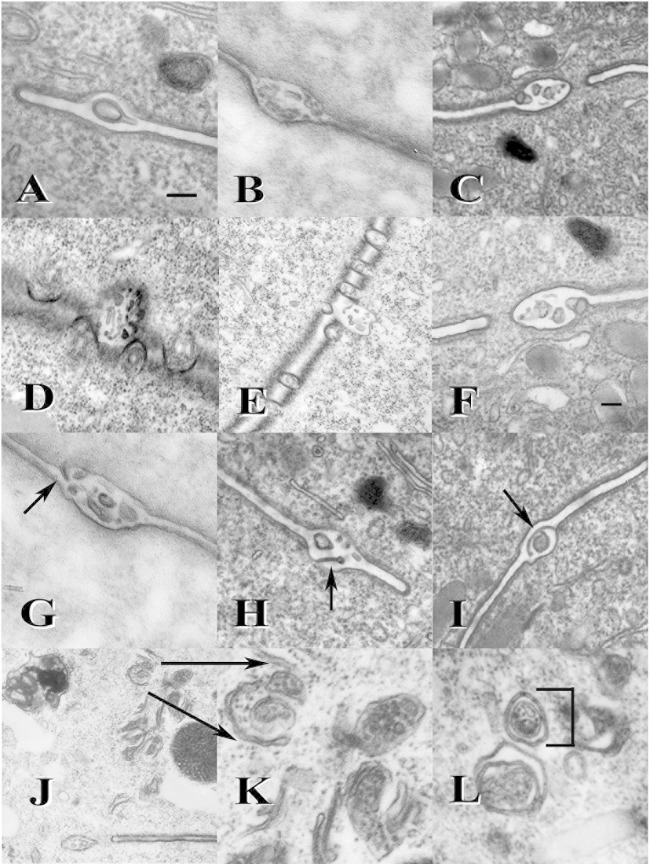
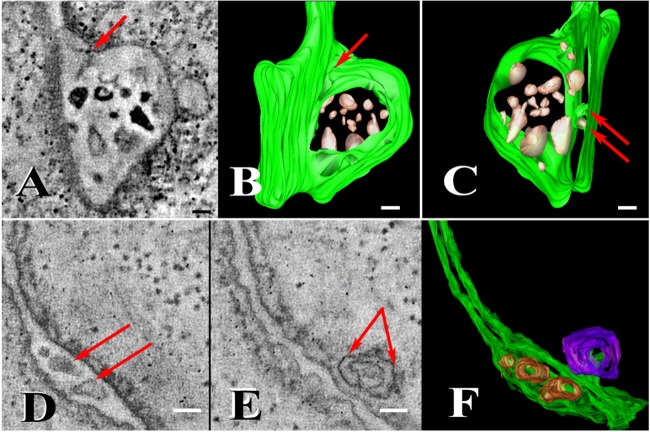
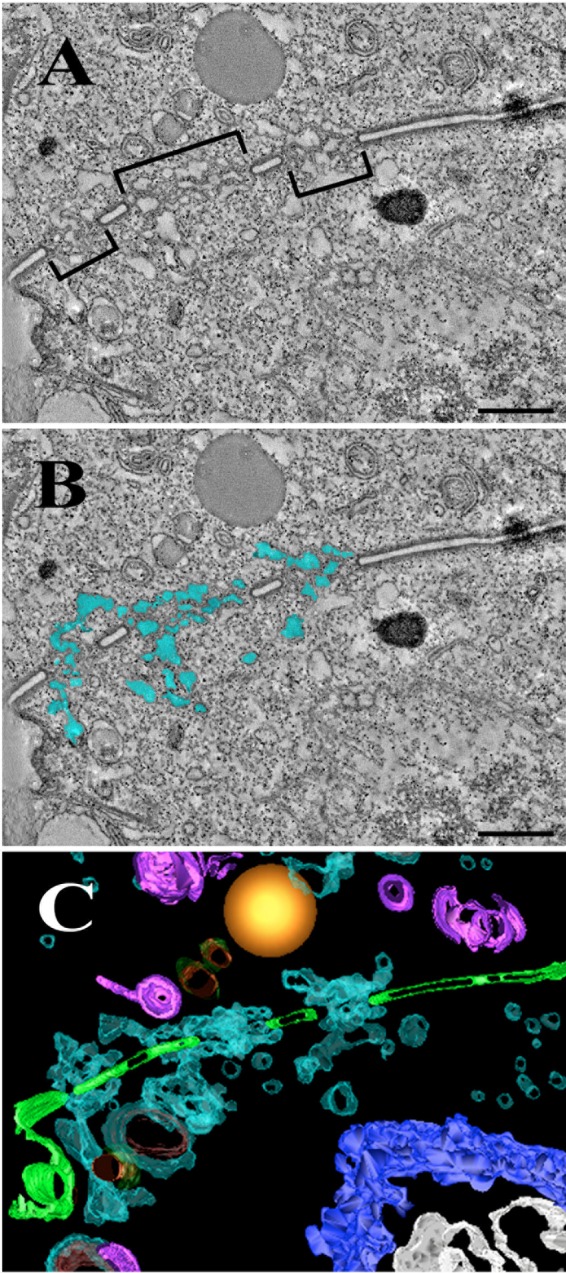
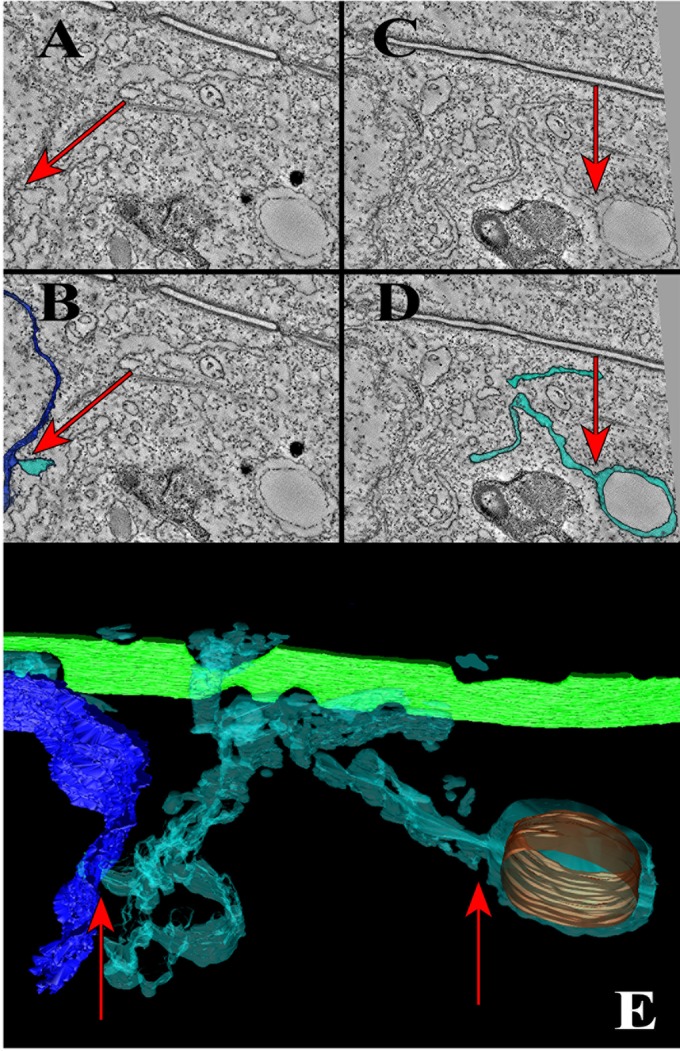
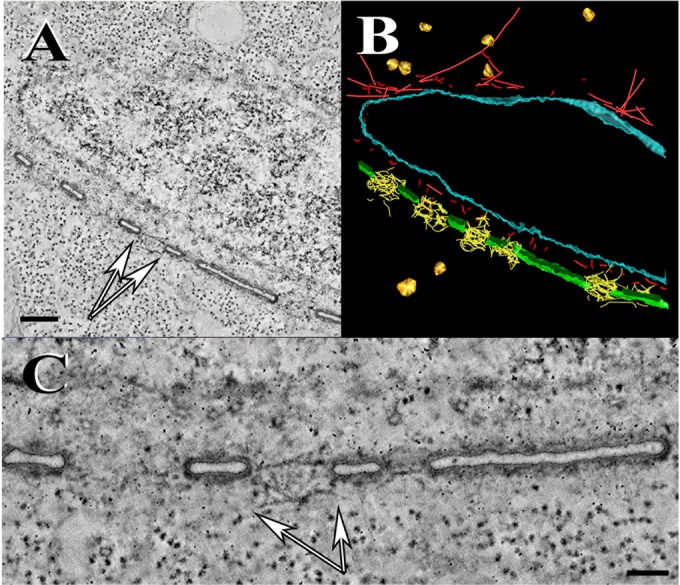
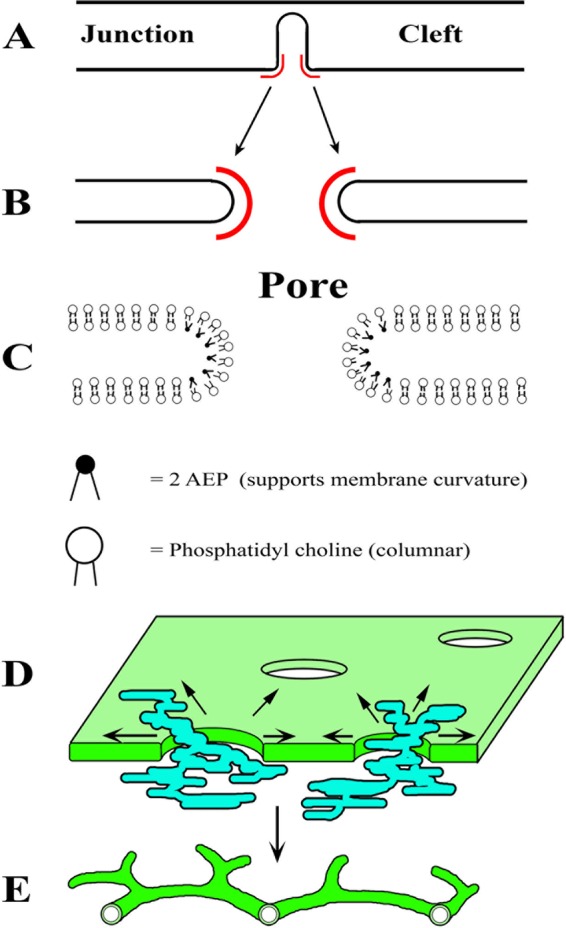
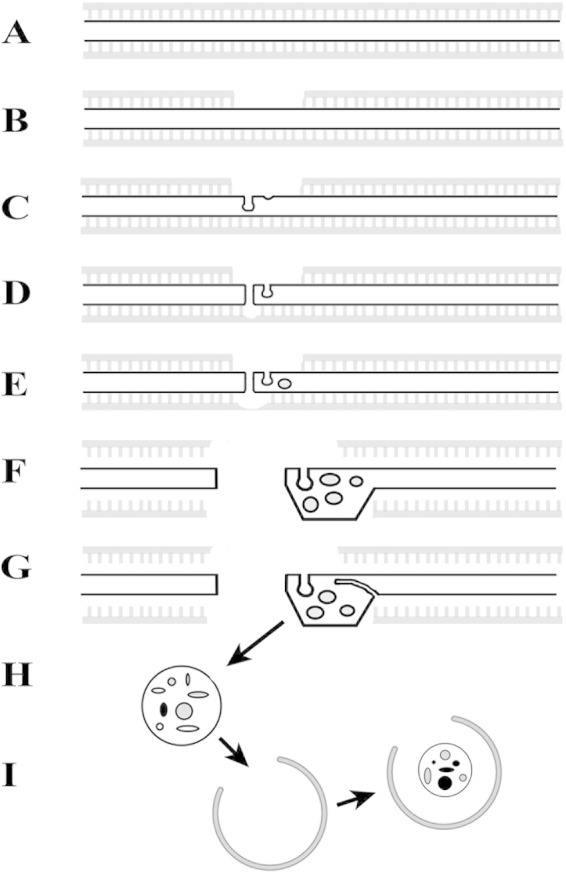
Using serial-section transmission electron microscopy and three-dimensional (3D) electron tomography, we characterized membrane dynamics that accompany the construction of a nuclear exchange junction between mating cells in the ciliate Tetrahymena thermophila. Our methods revealed a number of previously unknown features. (i) Membrane fusion is initiated by the extension of hundreds of 50-nm-diameter protrusions from the plasma membrane. These protrusions extend from both mating cells across the intercellular space to fuse with membrane of the mating partner. (ii) During this process, small membrane-bound vesicles or tubules are shed from the plasma membrane and into the extracellular space within the junction. The resultant vesicle-filled pockets within the extracellular space are referred to as junction lumens. (iii) As junction lumens fill with extracellular microvesicles and swell, the plasma membrane limiting these swellings undergoes another deformation, pinching off vesicle-filled vacuoles into the cytoplasm (reclamation). (iv) These structures (resembling multivesicular bodies) seem to associate with autophagosomes abundant near the exchange junction. We propose a model characterizing the membrane-remodeling events that establish cytoplasmic continuity between mating Tetrahymena cells. We also discuss the possible role of nonvesicular lipid transport in conditioning the exchange junction lipid environment. Finally, we raise the possibility of an intercellular signaling mechanism involving microvesicle shedding and uptake.


Figures

FIG 1
FIG 1
A schematic diagram showing the process of pair formation in mating Tetrahymena thermophila (A to D) and the accompanying modifications (E to H) of the nuclear exchange junction shown en face (central gray images) and in (rightmost images) as most of our TEM sections were oriented. (A) Costimulated cells form specialized tips. (B) Modified tips come into contact and adhere. (C and E) A broad adhesion zone develops, holding mating partners together and permitting membrane fusion events to occur, transforming loose pairs into tight pairs. (D) A mating pair that has been disrupted to reveal the exchange junction full of hundreds of fusion pores. (E to H) En face and cross-sectional representations of the adhesion zone prior to and during pore formation. (F) The exchange junction after membrane fusion events have created hundreds of small (0.1-μm-diameter) pores (5 pores are shown in the cross-sectional representation). (G) The same junction after pore expansion has enlarged the pores. (H) After pore expansion fronts collide, the residual membrane is transformed into a network or curtain of membrane tubules (90 nm in diameter).
FIG 2
FIG 2
Thin-section (80 nm) TEM images (chemical fixation) showing an early exchange junction. (A) Before pore formation during cell adhesion. The black arrow indicates where the junction cleft is in continuity with the extracellular space. White arrows indicate dense core secretory granules that have not yet discharged their contents via exocytosis. (B) Exchange junction showing completed exchange junction pores (black arrows) and elongated prophase 1 micronucleus (MIC). (C) Docked and discharged mucocysts in the vicinity of the exchange junction. Black arrows indicate mucocysts that have discharged their contents. White arrows indicate undischarged mucocysts. (D) Discharged, internalized mucocyst membrane (black arrow) and undischarged mucocyst (white arrow) near the exchange junction. Scale bars = 500 nm.
FIG 3
FIG 3
Freeze-substitution TEM showing nuclear exchange junction with well-preserved membrane and cytoskeletal components. (A) Arrows indicate the junction scaffold, a proteinaceous layer closely apposed to the cytoplasmic face of each cell's plasma membrane. Cross-struts are visible connecting the scaffold to the membrane. Scale bar = 100 nm. (B) Low-magnification image showing scaffold (white arrows), localized thinning of the scaffold near junction pores (white bracket), and membrane protuberances (black arrows, magnified in panel D). Scale bar = 500 nm. (C) At 1.5 h into costimulation, a mating pair with one point of physical contact. Arrows indicate membrane protrusions extending from upper cell and across the junction cleft. Scale bars = 100 nm. (D) Magnified view of protuberances in panel B. Scale = 100 nm.
FIG 4
FIG 4
Tomography of discharged mucocysts near exchange junction. Top panels show a mucocyst discharging its contents at the plasma membrane, adjacent to the junction cleft. (A) The black arrow indicates association between limiting membrane of the mucocyst and transjunction reticulum (TJR) that also infiltrates exchange junction pores. (B and C) Same image showing progressive modeling. Green, plasma membrane and mucocyst membrane that is transiently continuous with it; turquoise, TJR (white arrows); red, microtubules; purple, autophagosomes; brown, residue within the discharged mucocyst lumen. The region at the arrow in panel A is magnified in panel G, showing tight apposition but no continuity between the mucocyst membrane and the TJR. (D) Discharged, recycled mucocyst near junction showing continuity between the limiting membrane of the mucocyst and the TJR. (E and F) Same image showing progressive modeling. Arrows indicate contiguous membrane reticulum stretching from mucocyst toward exchange junction pore. The region indicated by the arrow in panel D is magnified in Fig. 3H, showing continuity of mucocyst lumen and lumen of the TJR.
FIG 5
FIG 5
TEM gallery (chemical fixation) of junction lumens filled with microvesicles. Panels A to F show swellings of the extracellular space within the junction cleft. Most are shown in close proximity to one or more pore margins, each filled with irregular shaped vesicles or tubules budding off from the plasma membrane. Panels G to I show a 2nd kind of membrane egression (arrows). A tightly compressed membrane fold appears to be delimiting contents of a junction lumen into a diverticulum that sequesters these materials into the. Panels J and K show multivesicular bodies (MVBs) in the vicinity of the exchange junction where junction lumens are actively being formed (arrows). MVBs are seen near double-membrane compartments resembling autophagosomes. Panel L shows autophagosome (brackets) encompassing an MVB (also in proximity to the exchange junction, not shown).
FIG 6
FIG 6
Electron tomography showing egression and pinching off of a vesicle-filled vacuole from the junction cleft. (A) Optical section from original tomogram showing a vesicle-filled junction lumen and a site of membrane egression from the cytoplasm (arrow). (B) Model generated from full 3D tomogram (see below). Green shows the plasma membrane of junction and junction lumen. Gold highlights internal vesicles. The arrow indicates a cleft where the plasma membrane appears to be pinching into extracellular space of the lumen. (C) Model optically rotated to view from “below.” Arrows indicate continuing process of membrane protuberance into the junction cleft contiguous with the junction lumen. This model allowed us to see membrane budding from the junction lumen and into the lumen of a developing autophagosome. Scale bars for panels A to C = 50 nm. (D to F) Electron tomogram showing an autophagosome forming directly around a membrane diverticulum as it buds off a vesicle-filled junction lumen. Panel D shows the small junction lumen with several shed microvesicles (arrows). Panel B shows the same region of exchange junction as in panel D imaged deeper in the section, showing a double-walled autophagophore in close association with the junction membrane. Green, plasma membrane; gold, membrane of extracellular, shed microvesicles; purple, autophagosome membrane. Scale bars for panels D to F = 100 nm.
FIG 7
FIG 7
Electron tomography highlighting the transjunction reticulum (TJR) infiltrating the junction pores. (A) Initial tomogram section through the exchange junction. Brackets indicate pores. (B) Same section as in panel A, with transjunction reticulum colored turquoise. Scale bars = 500 nm. (C) 3D model of same region showing the plasma membrane (green), the transjunction reticulum (turquoise), lipid droplet (gold), autophagosome membranes (purple), nuclear envelope (blue), and chromatin (gray). Mucocyst outer membranes are dark green, and their contents are brown. (For a 3D model of this, see Movie S1 in the supplemental material.)
FIG 8
FIG 8
Electron tomography highlighting the continuity of the transjunction reticulum (TJR) with nuclear envelope and the limiting membrane of a discharged secretory granule. (A) Initial tomogram section through the exchange junction. The arrow indicates the point of continuity between the TJR and nuclear envelope. (B) Same section as in panel A, with the TJR colored turquoise and nuclear envelope dark blue. (C) Same specimen showing a deeper section, highlighting the limiting membrane of a discharged mucocyst. The arrow indicates the point of continuity with the TJR. (D) Same view, with membranes colored turquoise. (E) Composite 3D model of same region showing both discharged mucocyst (right arrow) and contact with nuclear envelope (left arrow). The plasma membrane of the exchange junction is colored green, the TJR turquoise, and the nuclear envelope blue. Secretory granule contents are brown. (For a 3D model of this, see Movie S2 in the supplemental material.)
FIG 9
FIG 9
Electron tomography of a pre-exchange mating pair. The postmeiotic nucleus is docked at the exchange junction. (A) An optical section from the initial tomogram showing a nucleus docked at a junction with pores. White arrows indicate filaments (not membrane) occluding a pore (region is magnified in panel C). Scale bar = 250 nm. (B) Same region modeled in 3D with nuclear envelope (blue), plasma membrane (green), microtubules (red), intracellular vesicles (gold), and fine, 12- to 15-nm filaments (yellow). (C) Close-up of tomogram from panel A showing fine filaments (white arrows). Scale bar = 100 nm. This tomogram appears as a 3D model in Movies S3 and S4 in the supplemental material.
FIG 10
FIG 10
A model detailing membrane conditioning during pore expansion. (A) A membrane protrusion everts into extracellular junction cleft creating regions of tight curvature (highlighted in red). (B) After membrane fusion, the margins of a pore represent regions of tight curvature (red). (C) Asymmetric distribution of conical phospholipids such as 2-AEP within the extracellular leaf of a bilayer could help support tight curvature at the pores. (Panels B and C are modeled after the work of Kurczy et al. [38].) (D) Pores within the nuclear exchange junction are infiltrated with the transjunction reticulum (turquoise). As pores expand (black arrows), the TJR could supply specialized phospholipids (2-AEP) through nonvesicular lipid transfer. (E) Resulting network of membrane tubules once pore expansion fronts collide and merge.
FIG 11
FIG 11
Model illustrating pore formation. Faint gray lines represent the junction “scaffold” with struts connecting it to the plasma membranes (thin black lines). (A) Membranes during cell adhesion (0 to 1.5 h). (B) Clearing of scaffold over future pore site. (C) Evagination of membrane protuberances into extracellular space of the junction cleft. (D) Fusion of one protuberance creating a cytoplasmic bridge between cells. (E and F) Continued evagination into the vicinity of the pore excavates membrane supporting pore expansion and produces extracellular microvesicles within junction lumens. (G) Membrane folds delimit extracellular space, including microvesicles within a vacuole in a form of bulk endocytosis. (H) A membrane-bound vacuole with microvesicle contents (MVB-like in appearance) becomes internalized within the cell's cytoplasm, where it enters neighboring autophagosomes (I).

Similar articles

Cited by

References

    1. Wolfe J. 1982. The conjugation junction of Tetrahymena: its structure and development. J Morphol 172:159–178. - PubMed
    1. Orias JD, Hamilton EP, Orias E. 1983. A microtubular meshwork associated with gametic pronuclear transfer across a cell-cell junction. Science 222:181–184. - PubMed
    1. Suganuma Y, Shimode C, Yamamoto H. 1984. Conjugation in Tetrahymena: formation of a special junction area for conjugation during the co-stimulation period. J Electron Microsc (Tokyo) 33:10–18. - PubMed
    1. Cole ES. 2006. The Tetrahymena conjugation junction, p 39–62. In Baluska F, Volkmann D, Barlow PW (ed), Cell-cell channels. Springer, New York, NY.
    1. Bruns PJ, Brussard TB. 1974. Pair formation in Tetrahymena pyriformis, an inducible developmental system. J Exp Zool 188:337–344. - PubMed

Publication types

MeSH terms