. 2014 Sep 15;193(6):2821-30.
doi: 10.4049/jimmunol.1302498. Epub 2014 Aug 8.

Mechanistic target of rapamycin inhibition extends cellular lifespan in dendritic cells by preserving mitochondrial function

Affiliations

Mechanistic target of rapamycin inhibition extends cellular lifespan in dendritic cells by preserving mitochondrial function

Eyal Amiel et al. J Immunol. .

Abstract

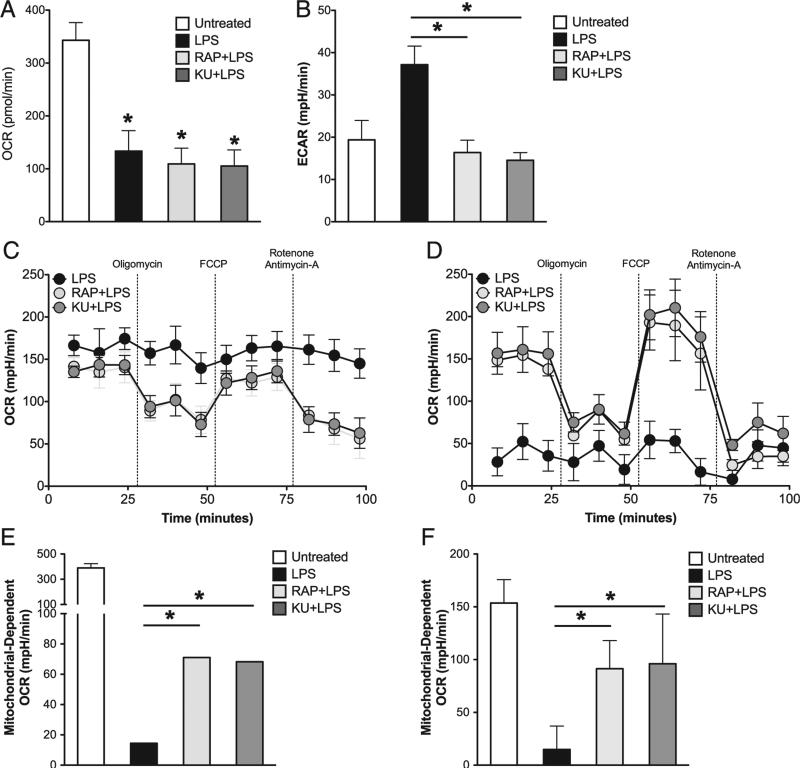
TLR-mediated activation of dendritic cells (DCs) is associated with a metabolic transition in which mitochondrial oxidative phosphorylation is inhibited by endogenously synthesized NO and the cells become committed to glucose and aerobic glycolysis for survival. We show that inhibition of mechanistic target of rapamycin (mTOR) extends the lifespan of TLR-activated DCs by inhibiting the induction of NO production, thereby allowing the cells to continue to use their mitochondria to generate ATP, and allowing them the flexibility to use fatty acids or glucose as nutrients to fuel core metabolism. These data provide novel mechanistic insights into how mTOR modulates DC metabolism and cellular longevity following TLR activation and provide an explanation for previous findings that mTOR inhibition enhances the efficacy of DCs in autologous vaccination.


Figures

FIGURE 1
FIGURE 1
mTOR inhibition of GM-DCs enhances cell survival and augments their ability to activate CD8+ T cells in vitro and in vivo. (A) GM-DCs were either left unstimulated or activated with LPS in the presence or absence of the mTOR inhibitors RAP or KU. Cell viability of GM-DCs at 4 d after DC activation by LPS was measured by FACS analysis of 7-AAD+ cells. Graph represents mean values ± SD of at least three independent experiments. (B) DCs were treated as indicated for 24 h, after which cells were washed and replaced with normal media. Three days after activation, DCs were cocultured at a 1:5 ratio with CFSE-labeled OTI CD8+ T cells for 4 d. T cell proliferation was determined by CFSE dilution within the CD8+ cell population. Graph represents mean values ± SD of three independent experiments. (C) Mice per group were immunized s.c. with DCs stimulated in vitro for 6 h with LPS only, LPS plus OVA, or RAP plus LPS plus OVA. Seven days later, peripheral blood was harvested and frequencies of Kb-OVA tetramer+CD8+ cells were determined. Each datum point represents tetramer frequencies in an individual mouse. Graph represents pooled results from two independent experiments. *p < 0.05.
FIGURE 2
FIGURE 2
LPS-mediated death in GM-DC cultures is dependent on NOS2 expression and NO production. (A) WT GM-DCs were either left unstimulated or activated with LPS in the presence or absence of the iNOS inhibitor SEITU and monitored daily for viability by FACS analysis of 7-AAD+ cells. (B) NOS2−/− GM-DCs were either left unstimulated or activated with LPS and monitored daily for viability by FACS analysis of 7-AAD+ cells. (C) Nitrite levels were measured by Griess reaction during 72 h in unstimulated or LPS-activated GM-DCs. (D) GM-DCs were either left unstimulated or activated with LPS, and the iNOS inhibitor SEITU was added to cultures at the time of activation or 1, 2, or 3 d after activation. Cell viability of GM-DCs at 4 d after GM-DC activation by LPS was measured by FACS analysis of 7-AAD+ cells. All graphs in this figure represent mean values ± SD of at least three independent experiments. *p < 0.05.
FIGURE 3
FIGURE 3
mTOR inhibitors attenuate LPS-mediated NOS2 expression and NO production in GM-DC cultures. (A) GM-DCs were either left unstimulated or activated with LPS in the presence or absence of the mTOR inhibitors RAP or KU and the kinetics of nitrite accumulation were measured by Griess reaction daily for the first 72 h after GM-DC stimulation. (B) NOS2 mRNA levels from three independent experiments were analyzed by quantitative RT-PCR 4 h after LPS activation in the presence or absence of RAP. Relative gene expression levels are compared with LPS treatment group. (C) GM-DCs were treated as in (A) for 24 h and analyzed for intracellular iNOS protein expression by FACS. FACS plots are gated on CD11c+ cells. (D) GM-DCs were treated as in (A) and the percentages of iNOS+ GM-DCs (left) and the mean fluorescence intensity (MFI) of iNOS+ GM-DCs (right) were quantified by FACS. All graphs in this figure represent mean values ± SD of at least three independent experiments. *p < 0.05.
FIGURE 4
FIGURE 4
Mitochondrial OXPHOS is preserved in GM-DCs activated by LPS in the presence of mTOR inhibitors. (A and B) GM-DCs were either left unstimulated or activated with LPS for 24 h in the presence or absence of RAP or KU. Basal oxygen OCRs (A) and ECARs (B) for each treatment group were determined by an XF extracellular flux analyzer assay. (C and D) GM-DCs were stimulated with LPS in the presence or absence of RAP or KU for 24 (C) and 72 h (D). Mitochondrial function was assessed by an XF extracellular flux analyzer assay. (E and F) Mitochondrial-dependent OCR was determined for experiments described in (C) and (D) by subtracting residual OCR after antimycin A/rotenone treatment from basal OCR levels. This calculation was performed for GM-DCs after 24 h stimulation (E) and 72 h after stimulation (F). Graphs in this figure represent mean values ± SD of at three independent experiments. *p < 0.05.
FIGURE 5
FIGURE 5
The mitochondrial inhibitory effect of LPS-stimulated NO production is a cell-extrinsic effect. (A) WT, NOS2−/−, or a 1:1 mixture of WT/NOS2−/− GM-DCs were stimulated with LPS. After 24 h, mitochondrial function was assessed by an XF extracellular flux analyzer assay. (B) DCs were treated as in (A) and monitored daily for viability by FACS analysis of 7-AAD+ cells. (C) WT GM-DCs were either left unstimulated or activated with LPS for 6 h in the presence or absence of RAP or KU. These cells were then coin-cubated with 6 h LPS-stimulated NOS2−/− DCs at a 1:1 ratio for 4 d. Cell viability was monitored daily by FACS analysis of 7-AAD+ cells. Depicted are the survival kinetics for each coincubation gated on the NOS2−/− GM-DCs in the coculture. (D) CD45.1 and CD45.2 DCs were either left unstimulated or activated with LPS in the presence or absence of KU for 6 h. Indicated combinations of the congenic populations were cocultured at a 1:1 ratio, and cell viability was monitored daily by FACS analysis of 7-AAD+ cells. Depicted are the survival kinetics for the CD45.2+ GMDCs in the coculture. Graphs in this figure represent mean values ± SD of two independent experiments.
FIGURE 6
FIGURE 6
The protective effect of mTOR inhibitors on DC survival are independent of macroautophagy. (A) GM-DCs were generated from Atg5flox/flox mice or Atg5flox × CD11c-cre mice and either left unstimulated or activated with LPS for 24 h in the presence or absence of RAP or KU. GMDCs were analyzed for intracellular iNOS protein expression by FACS. FACS plots are gated on CD11c+ cells. (B) GM-DCs were treated as in (A) and total nitrite accumulation was measured by Griess reaction after 48 h of stimulation. (C) GMDCs were treated as in (A) and cell viability of GMDCs at 4 d after DC activation by LPS was measured by FACS analysis of 7-AAD+ cells. Graphs in this figure represent mean values ± SD of two independent experiments. *p < 0.05.
FIGURE 7
FIGURE 7
GM-DCs activated in the presence of mTOR inhibitors are insensitive to glucose deprivation but are sensitive to disruption of fatty acid catabolism. (A) GM-DCs were either left unstimulated or activated with LPS for 18 h in the presence or absence of RAP or KU. Cultures were washed and then media replaced with complete media, glucose-free media, or glucose-free media supplemented with galactose. The percentage inhibition of ATP levels compared with the complete media group 30 min after media change is depicted. (B) DCs were treated as in (A) and cell viability was monitored 24 h after media change. (C and D) Cells were treated as indicated for 24 h and then plated overnight at 5 × 10⁴ cells per well onto PMM Tox-1 plates containing either glucose (C) or pyruvic acid (D) as the primary carbon substrate in nutrient-restricted media (no glucose, 5% FCS, 0.3 mM l-glutamine). NADH-reactive redox dye was added 18 h later and dye reduction by NADH was measured at 540 nm absorbance at the indicated times. Data are normalized to absorbance readings at time 0. (E) DCs were either untreated or stimulated with LPS in the presence or absence of KU. After 24 h, culture media was changed to glucose-replete media, glucose-free media containing galactose, or glucose-free media containing galactose in the presence of a fatty acid transporter inhibitor (etomoxir [eto]) or a glutamine antagonist (6-diazo-5-oxo-l-norleucine [DON]). Cellular ATP levels were monitored 4 d after media change. Graphs in this figure represent mean values ± SD of technical replicates that are representative of at least two independent experiments. *p < 0.05.

References

    1. Barton GM, Medzhitov R. Control of adaptive immune responses by Toll-like receptors. Curr. Opin. Immunol. 2002;14:380–383. - PubMed
    1. Steinman RM, Hemmi H. Dendritic cells: translating innate to adaptive immunity. Curr. Top. Microbiol. Immunol. 2006;311:17–58. - PubMed
    1. Akira S, Takeda K. Toll-like receptor signalling. Nat. Rev. Immunol. 2004;4:499–511. - PubMed
    1. Takeda K, Akira S. TLR signaling pathways. Semin. Immunol. 2004;16:3–9. - PubMed
    1. Amati L, Pepe M, Passeri ME, Mastronardi ML, Jirillo E, Covelli V. Toll-like receptor signaling mechanisms involved in dendritic cell activation: potential therapeutic control of T cell polarization. Curr. Pharm. Des. 2006;12:4247–4254. - PubMed

Publication types

MeSH terms